Humidity, Health, and the Sterling Chart
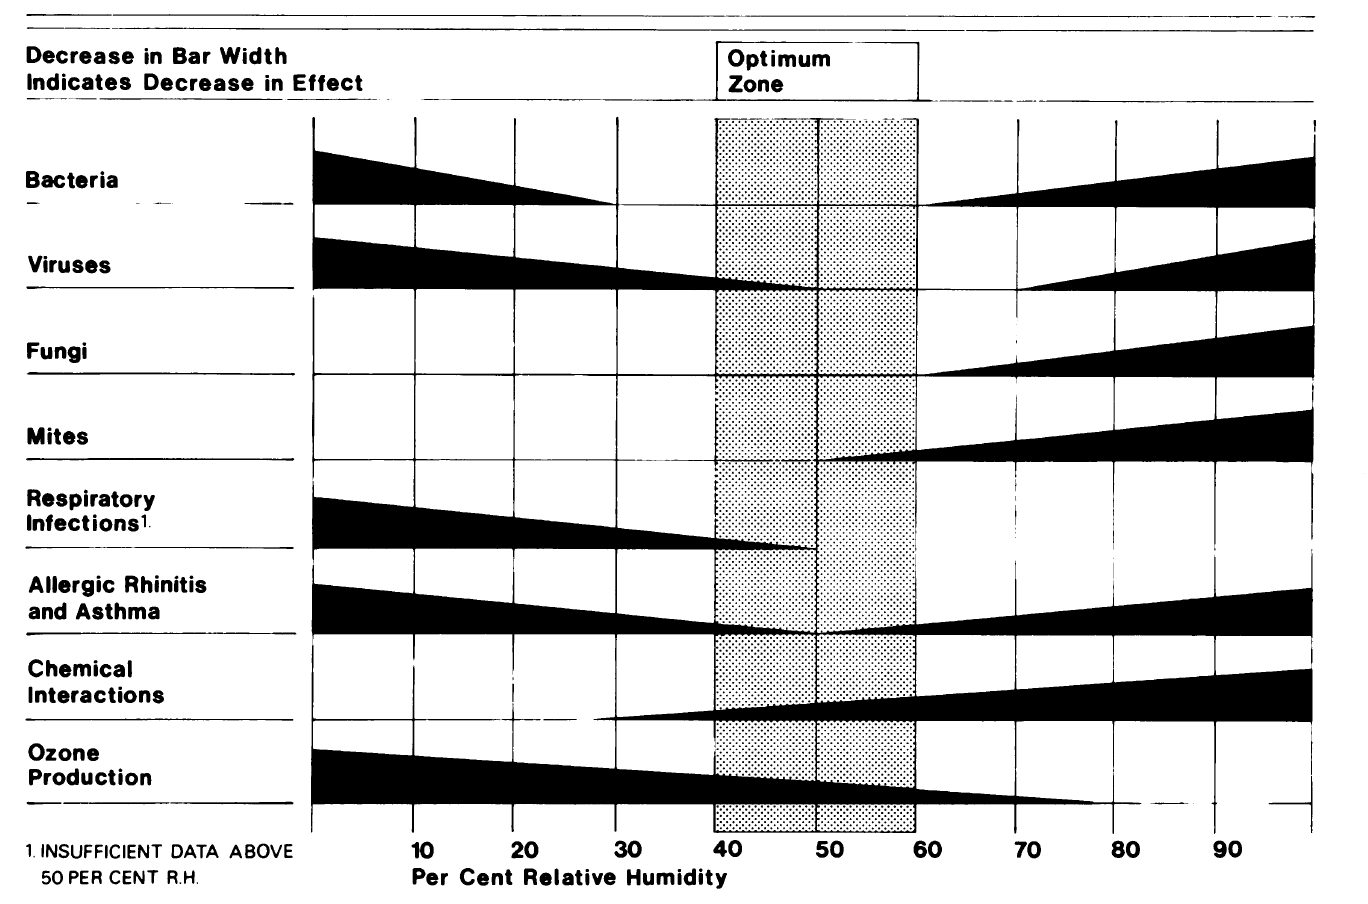
The classic chart demonstrating the importance of keeping to the middle of the relative humidity spectrum has been shown to countless attendees of classes, conference presentations, and webinars on building science, indoor air quality, moisture problems, and health. I can’t tell you how many times I saw it before I discovered the source. It’s often called the Sterling chart and is from a 1986 paper titled, Indirect Health Effects of Relative Humidity in Indoor Environments.
Because so many people have seen this chart in the intervening 34 years, it seems natural to us now. In 1986, however, the relation of health to indoor air quality was mainly about source control and ventilation. Even filtration hadn’t made it to the big leagues for residential IAQ. Humidity? That was a comfort, convenience, or durability issue because people don’t like to sweat in their homes, wipe up excessive condensation, or repaint or repair their walls.
This paper put humidity on the IAQ map. Of course, we were only a decade into the exploration of thermal bypasses and infiltration, and duct leakage was just beginning to get attention, so a lot of building science was fairly new. Still, just the fact that the chart from this article is shown so frequently is testament to the importance of this paper.
Familiar-sounding research
In this era of the coronavirus pandemic, it’s interesting to look at a paper from 1986 that discusses transmission routes for viruses as well as how they fare with humidity. They discuss aerosols carrying viral particles and transmission by direct contact with infected surfaces or people. Anyone who has paid attention to the news in the past six months has heard plenty about that.
The authors of the paper cite many other research studies about these topics. The influenza virus, for example, was shown in three studies to quickly become less viable as the relative humidity increased above 40%. Other studies, however, found that the infectiousness of influenza virus increased as the relative humidity decreased below 40%—in line with the other studies—but it increased again when the humidity went above 60%. Similar results applied to bacteria.
In addition to laboratory studies like the aforementioned, the authors also looked at epidemiological data on respiratory infections from schools, army recruits, and offices. What they found was that in every case where the correlation was significant, the buildings with higher indoor humidity had fewer respiratory infections. Most of the humidified buildings had relative humidity between 40 and 51 percent whereas their counterparts were at 31 to 41 percent relative humidity.
In addition to viruses, bacteria, and respiratory infections, the study also looked at allergens, like mites and fungi, and chemicals, like formaldehyde and ozone. The results were similar.
The optimal zone
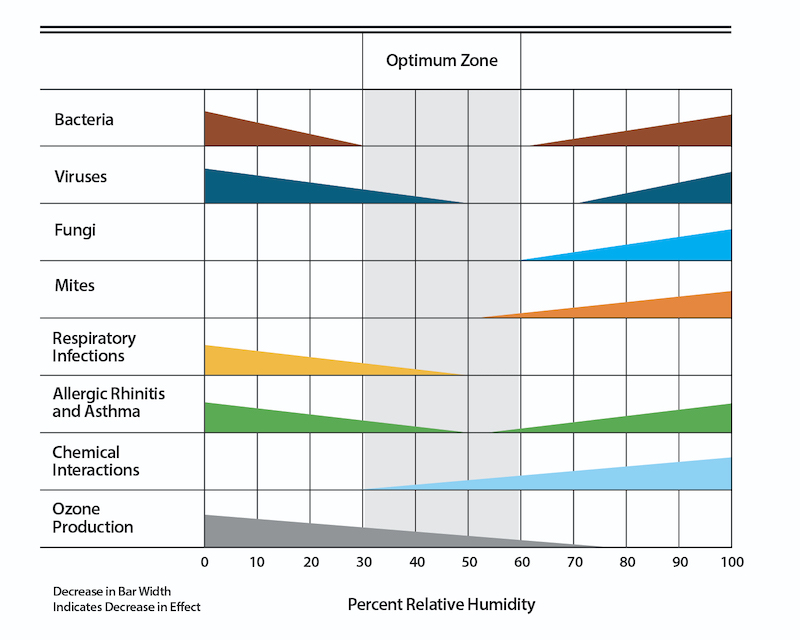
The authors of this paper summarized their results, which were really the results of a lot of other studies, in their now-famous chart. Some of the health factors get worse at lower humidity levels, some get worse at higher humidity levels, and some get worse at both ends of the humidity spectrum. Where you want to be, they concluded, is in the sweet spot in the middle, between 40 and 60 percent relative humidity. They showed that in the chart with a shaded region.
Some people are arguing that 40 percent relative humidity should be the low end of indoor humidity because of health reasons. (See last section below.) In cold climates, however, 40 percent relative humidity might actually make the indoor air quality worse. In a poorly insulated house with a lot of air leakage, the interior surfaces can stay cold enough to cause moisture accumulation and mold growth.
For that reason, I put the low end of the optimal zone at 30 percent relative humidity. The diagram at the top is the adaptation of the Sterling chart that I used in my book, A House Needs to Breathe…Or Does It? For houses with weak building enclosures, building science experts generally agree with a lower low end.
A caveat
But there’s a caveat in their paper that has gotten little notice over the years, probably because almost everyone who has ever used this chart in their training materials or presentations hasn’t read the original paper. Early in the paper, the authors state:
“A review of the available data on the indirect health effects of relative humidity shows that these effects do not uniformly increase or decrease in frequency or severity with a change in relative humidity.”
Take a look at that chart again. The statement above contradicts what they show there. In the conclusion of their paper, though, they state:
“The shape and height of the bars in the figure are only suggestive of an increase or a decrease in effect and do not represent quantitative data.”
I asked Bill Rose, the author of the fabulous book Water in Buildings, for his take on the Sterling chart. He called it the “zebra chart,” which I thought was a great description, and said about it:
“What I minded about the chart is that it makes the 40%-60% range appear unfavorable to organisms unfavorable to us. That’s a funny way for evolution to work—for bacteria and viruses to favor environments as far as possible from 50% RH.“
We certainly know that the SARS-COV-2 coronavirus causing such trouble now doesn’t seem to have trouble with higher humidity. Remember when we were told it would go away in April, like a miracle, as the heat and humidity increased?
The big takeaway
From a moisture perspective, we already know that high humidity isn’t so good. Porous materials get wetter as humidity rises, mold grows, and materials rot. We’re used to thinking of a maximum for relative humidity, but low humidity can also be bad in terms of health.
Dr. Stephanie Taylor is a medical doctor and researcher who is on a mission to establish a minimum of 40 percent for indoor relative humidity. According to Dr. Taylor, the negative health effects increase quickly enough once you drop below 40 percent that we need a hard stop there. The implication is that buildings in cold climates need to get more air sealing, insulation, and better windows if they have trouble with 40% relative humidity.
So, the big takeaway from this paper is that relative humidity near 50% is probably the best overall, but don’t take that chart literally. You can still get sick or have allergic reactions even at 50% relative humidity. And the risk doesn’t change linearly as shown in the chart. They made that part up.
If you’ve seen the Sterling chart before, did you know the name and the source?
Download the article: Indirect Health Effects of Relative Humidity in Indoor Environments
Allison Bailes of Atlanta, Georgia, is a speaker, writer, building science consultant, and founder of Energy Vanguard. He is also the author of the Energy Vanguard Blog. You can follow him on Twitter at @EnergyVanguard.
Related Articles
Controlling the Humidity in Your Home in Winter
Make Dew Point Your Friend for Humidity
What Is the Best Indoor Relative Humidity in Winter?
NOTE: Comments are closed.
This Post Has 25 Comments
Comments are closed.
Thanks Allison. I’m one of
Thanks Allison. I’m one of those who has used the chart for years without knowing the source.
It’s always been clear to me that the shape of the bars was “suggestive” and not quantitative. Mother Nature never really works that linearly.
The 40% “hard stop” is tricky for folks who live in cold places and don’t have good windows. Over 40% n January and February can mean wet glass and blackened window sills.
I agree, Dave. I think Dr.
I agree, Dave. I think Dr. Taylor has a difficult task ahead of her to get homes in cold climates to maintain 40% RH minimum. Triple pane windows with 3 low-e coatings ain’t cheap.
I believe that most of the
I believe that most of the time indoor storm windows like Indow will prevent condensation on all but the most extreme days during the heating season. The idiotic practice of using interior gyp board window sills should be illegal of course. And all homeowners should invest in a couple of thermo-hygrometers to keep an eye on indoor humidity.
Maintaining 40% is also
Maintaining 40% is also tricky in the summer in arid climates, where it’s not unusual to see 25% to 30% indoor RH in cooling season unless the house is tight. Humidification is futile in this situation (think pouring water into a colander).
The only practicable solution in this case is air sealing. My new home (SE Arizona) tested out at 0.52 ACH50 and the indoor RH never goes below 40% – summer or winter. I avoid using spot ventilation for showers and when cooling with water, except during monsoon season.
Previous comment should have
Previous comment should have been: “I avoid using spot ventilation for showers and when COOKING with water…”
Agreed David,
Often the moisture “we need” is leaving through some exhaust. Retaining what we can or should strategically is awesome. During cold snaps I will run the 3rd floor fan “on” for 30 minutes during “bath-time” and the home integrates it wonderfully, and much less noise for the bathers. I love how eco-bee has the “run fan for X minutes” button, so even though my wife doesn’t want the stove vent on we can mix the home.
Allison, do you have a
Allison, do you have a preferred method of measuring indoor humidity?
Corey, I use a thermo
Corey, I use a thermo-hygrometer with three remote sensors to keep on eye on things at home. (Here’s the one I bought from Amazon.) They claim 5% accuracy. For data logging, I use Hobo temperature/RH loggers from Onset that have a 3.5% accuracy. Keep in mind that the accuracy of the RH depends on the temperature, too, so if the temperature is off, the RH can be off even more.
Allison wrote: “..if the
Allison wrote: “..if the temperature is off, the RH can be off even more.”
That would only be true if the instrument measures dew point & temperature and from that, calculates RH. I know of no instrument that does that. That said, relative humidity sensors are indeed affected by ambient temperature (stating the obvious), so if the ambient temperature at the sensor location is not representative of the building, then the reported RH at the sensor will not be representative of the RH of the building!
David, thanks for the
David, thanks for the correction.
Excellent article as always
Excellent article as always Dr. Bailes.
I would be very interested to see a study showing the relationship raw heat might have regarding odors/microbial growth in addition to relative humidity and ventilation of said space. (i.e. something akin to the psychometrics chart) Correct me if I am wrong, but it is my understanding that there are many more variables contributing to odors/microbial growth than relative humidity.
Jonathan, yes, a lot of
Jonathan, yes, a lot of factors influence odors and microbial growth. The biggest is the source. There are a lot of chemicals that can smell things up, and there are a lot of things that can grow. For those that grow, moisture is one of the requirements but so are the right temperature range, food, and spores. I can’t think of a study that looked at the relationship you’re asking about, but I’ll keep my eyes open for one.
I have read that one of the
I have read that one of the reasons that we are more susceptible to certain airborne pathogens at low humidity is because our airways are drying out, thus removing the protective barriers to those pathogens, e.g., mucus membranes. In other words, the pathogens are not getting stronger, we are just getting weaker.
Roy, I think I’ve seen that
Roy, I think I’ve seen that somewhere, too. Maybe it’s even in the ASHRAE Handbook of Fundamentals.
If memory serves Joe
If memory serves Joe Lstiburek’s book Moisture Control Handbook mentions that low RH results in a suppressed immune system.
I’ve been the Chicago suburbs
I’ve been the Chicago suburbs for 25+ years. From my experience, most people don’t do a very good job of maintaining their central humidifiers and only use a portable if someone (typically children) is already sick. In homes and office buildings we’ll see humidity in the 10-20% range or lower for most of January and February. As you mention 40% would not only make a mess on the windows, but the unseen moisture in walls could be catastrophic.
Lee, yeah, we have a lot of
Lee, yeah, we have a lot of work to do on buildings before we get to the point where we can keep them all at 40% RH minimum.
Wait! No, I’ve got an idea for how we can do it with no improvement to the building. If we turn the heat off completely and keep the building cold, it’ll be a lot easier to get a higher RH, and we can save energy at the same time!
LOL. It’s all relative,
LOL. It’s all relative, right. In our a people spaces at Fermilab, DOE does not allow humidification. Only process or experimental buildings that require humidity for the process are allow to have humidifiers installed.
I build in coastal NC and the
I build in coastal NC and the humidity here is most always extremely high. After tons of reading on research and some experimentation on my own, I install dedicated dehumidifiers in every home. Completely separate and apart from the HVAC system. It is available and gets use all year round. Even in winter where we have rainy months, it will kick on to keep us around 45%. We have four swing months where it is the only thing running and then in summer, it will kick in to help the HVAC with latent load. Our houses are really tight (>.50ACH 50) so our sensible load is lower than most so latent removal is lower as well. Money well spent.
From by BIL the Doc: As an
From by BIL the Doc: As an ENT, I thought I would share my personal perspective. This information seems to add some credibility to my perspective.
Most upper respiratory infections start with a viral illness, and then have secondary bacterial infections. In the past, I used to lecture on antibiotic resistant sinusitis and otitis media for which I researched the incidence and seasonal variations between infection rates in the southern US and northern US. Therefore, it is not surprising that COVID is more contagious in the south now and less so here in the north. Ever wonder why the COVID incidence has dropped in Wisconsin with many people ignoring social distancing and masking precautions. I suspect a lot has to do with the rate of mucociliary transport which is impaired dramatically by dehumidification with heavy use of air conditioning during the summers because of the oppressive heat in the south and forced air heating during our brutal winters in the north. We all stay too much indoors in dry environment during the winter and the south does the same now. The repeated changes of temperature and humidity is also detrimental to the health of the nasal mucosa. Not too surprising that the incidence of COVID infections is low here in the northern climates and increasing in the south this summer. In October the reverse will occur again. Maybe we should all be snowbirds. It may not have as much to do with ”opening up” or public policy as with our strengthened or weakened passive immunity to respiratory viruses. The entry way for respiratory viruses into our bodies are usually by touching our eyes or nose with contaminated hands to seed the nose, and more difficult to catch via airborne droplets, especially in a humidified environment. Interestingly, saliva seems to have some ability to inactivate viruses transmitted into the mouth. If a virus touches our nasal mucosa this time of the year, with a healthy mucosal gel blanket, which as part of our passive immune system which acts like a force field, the virus will be transported by our mucociliary transport mechanism within minutes into the stomach and inactivated by gastric acid, thereby never having a chance to enter or infect our respiratory epithelium. Think of the analogy of a flowing river versus a stagnant pond. Not only does masking help transmission of droplets to inanimate surfaces when someone speaks, coughs or sneezes, it more importantly prevents or reminds people from touching their nose. Another advantage rarely discussed is that masking also increases the intranasal humidity by preventing insensible water losses.
Here in the hot humid
Here in the hot humid southeast (north Florida) I regard 45% RH as the “Holy Grail” humidity goal…It takes a high performance HVAC system in a well-sealed home to hit that number during cooling season (March – November).
Happily it rarely gets cold enough here for 45% RH to cause problems during our so-called “heating season” consisting of a few days in December, January, and February.
WHY DOES THIS SITE’S INANE CAPTCHA SYSTEM FORCE ME TO IDENTIFY MULTIPLE IMAGES / PANES WITH BIKES BUSSES WHATEVER?!?!
I’M SO DONE WITH THIS!
I have a pair of window
I have a pair of window shakers that can pull my leaky 1980s climate zone 2A home down to 45% given enough time. Both units are undersized so their running at 100% duty cycle all summer long helps.
Great articles, especially
Great articles, especially like consequences of high MERV filters and low velocity ducts. However, should throw be reassessed? Throw/direction of throw (and return(s)) are quite important. Downflow may be the best, ceiling to floor, to prevent horizontal spread (worked in a tsetse fly lab that studied sleeping sickness, direction of flow was important). And, IAQ sensing separate filtration units (e.g., Dyson, etc.) may be better than dropping pressure/throw with a high MERV filter. As to humidity, the spray dryer effect is important too. I worked for P&G Europe on spray dryers to make powdered detergent and clothes dryers that vent into rooms (Europe has largely outlawed vented dryers as fire hazards). Low humidity results in rapid mass transfer, droplets at near 100% RH in lungs, will lose moisture and rapidly reduce in size in under a second, becoming more buoyant. As to clothes dryers, I ran tests on enzymes (individually smaller than SARS-CoV-2), which I collected in a room via air filtration. However, it is quite unlikely to find an enzyme “isolated”, same with SARS-CoV-2 (thus, the 0.125 micron size is probably not too important). Think about it, what is the likelihood that a human would exhale a single, isolated virus? Think about the chemistry/physics, your body is a bag of water, things are sticky (natural surfactants, etc.). All the talk about needing submicron filtration is, IMHO, overblown(noting I’ve seen people test positive for antibodies against enzymes they inhaled when not wearing respirators, while working with highly concentrated solutions from suppliers). I would guess that filtration of 1 micron particles is probably sufficient for most biologics (I also worked on chemical protection suits for the US Army, that was a different story). Many studies that “detect” SARS-CoV-2 are using genetic tests that will react with “flotsam”, i.e., harmless tiny pieces of SARS-CoV-2 virus (think “touch” DNA). No doubt, the reality is complicated. Time to reassess throw, reassess direction of flow, reassess use of separate air filtration units, reassess whether MERV 13 is really that important (or in fact quite detrimental to throw/FPM/CFM), reassess importance of humidity to avoid spray dryer effect, . . . . I believe HVAC experts, scientists and engineers will be the ones that make a great impact in helping biologists/medical doctors understand how we can hinder transmission in our indoor or other “enclosed” environments.
Allison, you are a great
Allison, you are a great example of an ever questing mind. Always question received wisdom.
This summer may remind people that whatever we do to modify indoor climate, the outdoor climate is going to be quite a moving target in the future. Talking on the phone to a person in Florida last week I realized the my outdoor temperature in Vermont was the same as hers – low 90’s.
The problem is indoors
The problem is indoors environments, therefore you can have a humid climate but still have dry indoors environments. One of the biggest problems is when HVAC systems recirculate the air internally, allowing it to get drier and drier, and allowing virus load to build up over time. There is a hypothesis that is unbreakable, about the spread of COVID-19.
Fresh air and high rates of indoor – outdoor air exchange greatly reduce transmission. A large number of people in the same indoors space for a prolonged time is a problem – in cities with crowded housing issues, imposing a lockdown actually creates a one-off spike in spread. I predicted this about London. The more vocal people are, breathing in and out, the greater the viral load. Hence parties are a problem, events in restaurants, indoor sports, singing, meat processing plants, etc.
The level of humidity inside is an important factor, but there are several factors as I describe. Each of them make the spread more or less bad; none of them are alone the problem or the solution.
“Contact” and surfaces and droplets from coughing etc have been over-rated in this pandemic. Almost all the spread has been via indoor environments and behavior, via airborne viruses (aerosols). The rate of “R” is a classic illustration of the limitations of an “average” when the data is comprised of outliers. This virus has not spread steadily from person to person in normal daily life at all, and the draconian restrictions on normal day to day life, is like carpet-bombing a country to eliminate its leadership – when a few drone strikes would solve the problem without all the collateral damage. Maurice de Hond does a good visual presentation here, contrasting the orthodox, wrong visual presentations of the rate of “R”, with how spread really occurs:
https://www.youtube.com/watch?v=WPM84WsJA7I&feature=youtu.be