The Diminishing Returns of Adding More Insulation
If you’re building a house and want to have a really good building enclosure, you need it to be airtight, handle moisture properly, and have a good amount of insulation. Ideally, you’d also consider the effects of solar radiation on the home, but for now let’s just focus on the insulation. What exactly is “a good amount” anyway?
Insulation is like alcohol
If you’re a practical person, I’m sure you realize that life has a tendency to make you aware of certain limits. After the first few drinks in an evening, for example, further libations have less and less of an effect. Well, less and less of a positive effect anyway. Unfortunately, diminishing faculties obscure the diminishing returns, and you wake up the next day wondering how your head got in that vise. (Not that I know anything about that. I take all things in moderation, including moderation.)
The same is true with insulation. Below we’ll take a look at what happens as you keep increasing the R-value in a wall. If you just want to understand the concept of diminishing returns, you can skip ahead to the text below the graph. For the building science geeks out there, though, I need to tell how I generated the numbers for the graphs.
Calculating heat flow
The equation to calculate heat flow over a heating season is Q = U x A x HDD x 24. The result is the total number of BTUs of heat that flow through the wall under those conditions. The only thing that varies in the graph below is the R-value.
U = 1/R A = 1000 square feet HDD = 4400A is the wall area, and I chose 1000 sf as a representative value. HDD is the number of heating degree days using a base temperature of 65° F, and, for 4 of the graphs below I chose a city in IECC climate zone 4, such as Portland, OR, Asheville, NC, or Louisville, KY. For the other example I used Atlanta and our 3000 HDD. For all of the graphs, I divided the result of the calculation by 1 million and plotted MMBTU (million BTU) instead of having all those unwieldy zeroes on the axis.
OK, now we’ve got those details out of the way. Let’s see what it means.
Getting less and less from more and more
First, here’s what everyone knows already. As you keep adding more and more insulation, you keep reducing the heat flow through the wall more and more. The blue line in all the graphs below shows the heat flow through the wall, and the red columns show either the stepwise or cumulative reduction in heat flow compared to what it was with an R-2, R-11, or R-16 wall. An uninsulated standard 2×4 wood-frame wall has an R-value of about 3, so our starting point of R-2 in the first graphs is close to that of an uninsulated wall.
This first graph shows cumulative reduction in heat flow. Notice carefully how it grows.
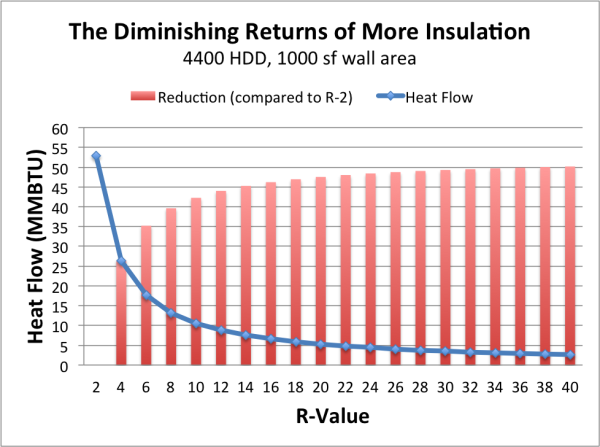
If you can see what’s really happening here, you don’t need the next graph. The important effect here is that most of the reduction in heat flow happens early on. With each addition of R-2 to the insulation level, the reduction declines.
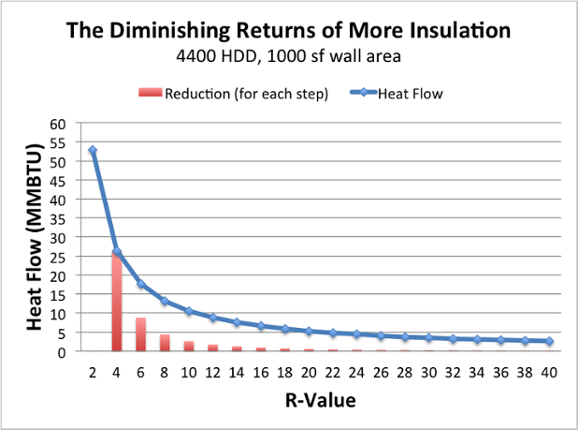
An easier way to see that is with the graph below. Here I’ve plotted only the reduction achieved for a given step of R-2. Once you get out to about R-14 or so, at least on the scale shown here, the additional insulation results in pretty small reductions in heat flow.
From this we can draw our first conclusion:
Important Lesson: Adding any insulation to uninsulated homes can save more energy than adding more insulation to already-insulated homes.
Where the curve is more vertical is where most of the action occurs. Once it starts flattening out, you get less and less from more and more. That’s what is meant by the term “diminishing returns.”
In fact, this whole exercise harkens back to my Flat or Lumpy article, in which I wrote about the importance of not missing areas that need to be insulated and getting a uniform coverage. My friend Mike MacFarland helped make this connection for me last night when he texted, “This is why it’s so critically important to use building performance equipment to locate and fix all of those areas in homes where the vertical part of the graph exists.” Indeed!
What’s your starting point?
The previous graph helps understand how important it is to fix uninsulated homes, but it could lead to the wrong lesson when it comes to designing new homes. If you’re designing a new home and trying to find out how much energy you might save by adding more insulation, you’ve got to choose a more reasonable starting point.
In Atlanta, for example, you’ve got to put a minimum of R-13 insulation in your above-grade, exterior walls. Factoring in the effect of all that lower R-value wood in a standard 2×4 wall (16″ on center), the whole-wall R-value is about R-11, so that’s our starting point.
If you’re framing with 2x4s, you could go with a higher density insulation and get R-13 in the same space. You could also build thicker walls or add exterior insulation or both, with the result of higher R-values. However you do it, we get a similar graph of cumulative heat flow reduction as our first graph above.
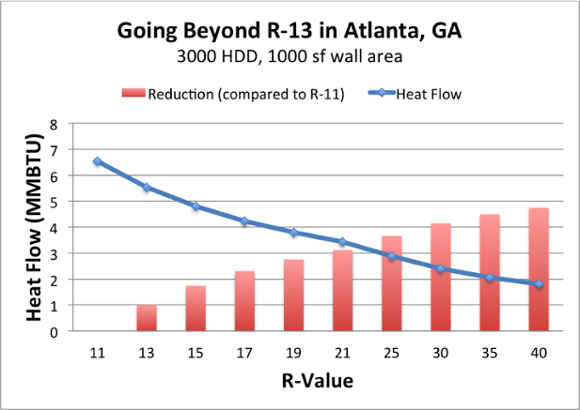
The graph below shows the stepwise reduction in heat flow when you go from R-11 up to R-40 walls (adjusting the calculation for Atlanta’s 3000 HDD). Each red column shows the reduction in heat flow for just that step (e.g., R-11 to R-13 or R-30 to R-35). As before, with each step up in R-value, the potential savings decrease for each unit of R-value.
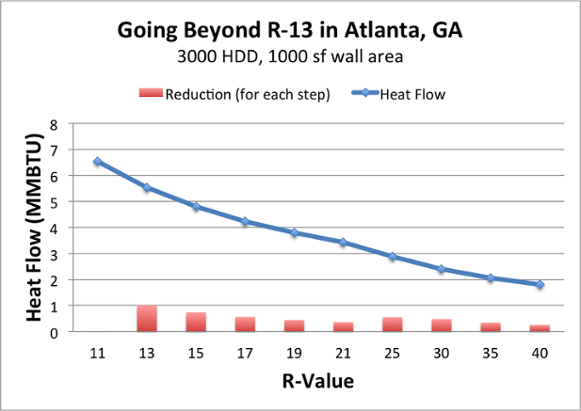
The key is to figure out how much it’s going to cost you to get those savings. Going from R-11 to R-13 just involves using a different insulation, but going from R-13 to R-15 (the whole-wall R-value for 2×6 walls) requires going from 2×4 to 2×6 walls and thus more insulation, more lumber, and doors and windows with wider jambs. That means going from R-11 to R-13 is has a much higher potential of being cost effective than going from R-13 to R-15.
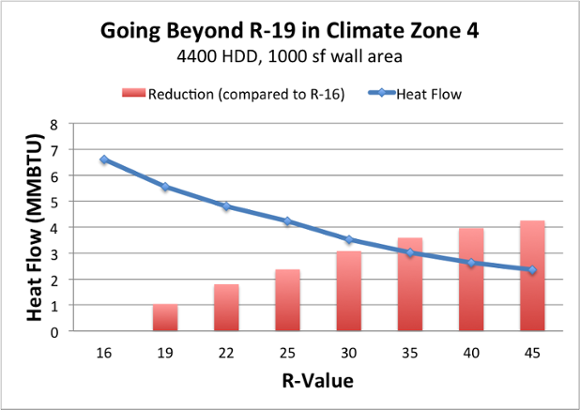
What if you were to insulate your walls to R-19 in the climate zone 4 cities I used for the first graph? When you put R-19 insulation in the cavities and mix in 2×6 framing that’s only R-7, the whole-wall R-value is about R-16, our starting point in this case. The same pattern as before holds in this case.
And the returns still diminish, as you can see in the stepwise reductions shown here.
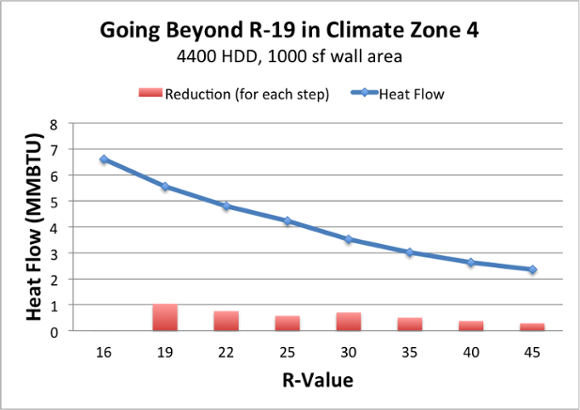
These last two graphs are based on calculations using 4400 HDD, representative of some climate zone 4 cities.
Too much is never enough
The debate over how much insulation to use is an important one. There’s no clear-cut answer. I can’t tell you, “Use this much in climate zone 4 and this much in climate zone 5” because there are multiple variables involved. Here are the main ones:
- Climate zone
- Type of heating and cooling system
- Fuel used for heating
- Utility costs
- Photovoltaic (solar electric) system costs
- Comfort
- Your interests and goals – utility bills, carbon footprint…
In my Mastering Building Science course, which begins on 27 October 2014, I’ll dive into these variables and show how you might decide what’s the optimal amount of insulation to use. You’ll also get my spreadsheets if you sign up.
Take heating system types, for example. The graphs above show the amount of heat moving through that thousand square foot wall, but the amount of heat you pay for may be different from what’s flowing through the wall. If you’re heating with a furnace that’s 80% efficient, you’ll have to buy 25% more BTUs than you lose through the wall. If instead you use electric resistance heat, you buy the same number of BTUs you lose, but with a different fuel and at a different cost. All that and more factors into the decision.
I’ve had this topic on my list for a long time, and finally got spurred to write about it because of the debate over the Passive House program and the insulation levels required to meet the requirement for the annual space heating demand to be no higher than 4,750 BTU/sf, no matter what climate you’re in.
Martin Holladay, the Energy Nerd at Green Building Advisor, had a great article about it last week: It’s Not About Space Heating. He reported on a recent presentation by Marc Rosenbaum, and the issue of the diminishing returns of adding insulation played a big role (although that term didn’t appear). Rosenbaum’s main point is that spending a lot of extra money on the building enclosure to chase those last BTUs is probably not the best way to go. Go read the article. And be sure to read Rosenbaum’s comment (#2), too.
So, what’s the answer?
How far you should go depends on all those variables above, including your goals. If you want to build a net zero energy home, you’ll go further than someone who wants only comfort and reasonably low energy bills, who will go further than someone who wants the lowest upfront cost.
Some people look at the graphs above, especially the second one, and conclude that it’s silly to go beyond the first few steps since you’ve already gotten most of the reduction you’re going to get. That is a mistake. First of all, you have to make sure you’re choosing the correct point for comparison. The first two graphs use a starting point of an uninsulated wall.
If you’re designing for new construction, you have to choose a starting point that is at least at the level required by your local code. As you can see in my R-13 and R-19 examples, the returns don’t diminish nearly as quickly when you start higher. That may sound odd, but it’s true. That doesn’t mean all those higher levels of insulation are cost effective, though. You’ve got to do the calculations to find where your optimum is.
The bottom line is that although you can certainly put R-40 insulation under your slab or R-80 insulation in your walls, it may not be the smartest thing to do. Take a look at the bigger picture and see whether you might be better served by reducing the size of the home, finding ways to save on water heating, appliances, and plug loads, or investing in photovoltaics. Whether you’re trying to reduce power plant emissions or just save money, at a certain point, it becomes wiser to stop with the insulation and spend your money on the stuff that, dollar for dollar, will yield better results.
Allison A. Bailes III, PhD is a speaker, writer, building science consultant, and the founder of Energy Vanguard in Decatur, Georgia. He has a doctorate in physics and writes the Energy Vanguard Blog. He also has a book on building science coming out in the summer of 2022. You can follow him on Twitter at @EnergyVanguard.
Related Articles
Flat or Lumpy – How Would You Like Your Insulation?
Attic Stairs – A Mind-Blowing Hole in Your Building Envelope
Will Open-Cell Spray Foam Insulation Really Rot Your Roof?
Do You Know Your Building Science Climate Zone?
How to Grade the Installation Quality of Insulation
NOTE: Comments are closed.
This Post Has 13 Comments
Comments are closed.
Allison,
Allison,
Another excellent effort.,
It would appear all blue lines going to the right are asymtotic to the X axis. Heat loss cannot ever got to zero? 🙂
Once again you have posed the question which has deviled mankind (and womankind) from the earliest days of sentience: “How much is enough?”.
All the best.
Is this the right time to ask
Is this the right time to ask about balancing convective heat transfer with conductive heat transfer? Maybe a perfectly leaky wall is a little OK?
Allison,
Allison,
Great article. I am curious about these comments you made above.
“In the end, I think it’s generally easier to build a house with a really good building enclosure and supply your heating with a mechanical system, ideally a heat pump that can be powered with PV-generated electricity. PV modules last decades and don’t lead to overheating or require thermal mass.”
I presume you are referring to an air source heat pump. I also presume the solar thermal application being avoided in preference to solar P.V. would be a > distribution temperature application and not a source side to a heat pump application.
I am with you on the first part and the last part of your approach but I think air source heat pumps are easily beaten at the task of site sourcing thermal energy. This approach is along the same lines of the diminishing returns theme. The air source industry applications of heat pumps makes no attempt and has no ability to modify the source conditions and the ground source industry has stubbornly insisted there can be no compromise on the installation of the heat pumps they call “geothermal”. (really only water source)
So my 2 cents is to first reduce the loads with the building envelope and the passive aspects…then further reduce the loads by some investments in active thermal infrastructure elements that more effectively site source thermal energy and thereby reduce the required KWH… and then invest in the site generation aspect of P.V. to reach net zero.
None of the approaches should be looked at by themselves. Diminishing returns exist with each one and the whole of the project should be considered before each element is defined.
“Let’s see, what’s
“Let’s see, what’s cheaper, insulation or solar panels? Fails to use time value of money, i.e. a savings of just $5 per month at 6% interest over a 30 year mortgage is worth just over $800 now, which again, is a lot of insulation!”
Q1) Depends – how much insulation vs how many solar panels
Q2) $800 buys quite a lot of some insulation, not much of some other insulation, and certainly nowhere near enough 2x6s and wider window jambs.
But I have to say that was a great rant to read – Who knew how fun “the first two inches” could be?!
Mac Sheldon just described
Mac Sheldon just described everything a spray foam salesman would say to sell his product in a politically correct way without taking down his competition. Nice article Allison. A suggestion for another article would be an equal comparison between a properly air sealed home using fiberglass, cellulose or mineral wool versus a home insulated with open cell spray foam versus a home with closed cell spray foam. A chemical analysis of the air quality in the 3 comparable homes would be worth examining as well. Maybe Mac Sheldon’s employer “Demilec” has something to share?
SeanK wrote: “I just
SeanK wrote: “I just watched an interesting video that claimed matching the wall R value with the roof R value is a valuable practice”
That’s Ted Clifton. I believe he’s referring specficially to non-vented cathedral ceilings. The prescriptive codes that require roughly double the R-value for ceilings vs. walls are based on typical vented attics. In that case, the cooling delta-T is much higher than for the walls. Moreover, as Mac alluded to in his comment, you need additional R-value to make up for the fact that the ceiling insulation isn’t fully encapsulated on six sides. Insulation “in the open” won’t perform as well as the same thickness in a sealed wall cavity.
Unfortunately, prescriptive codes don’t allow for roof configurations where double R-value isn’t the appropriate, at least not in the residential section, so it may be necessary to use the performance approach for compliance.
That said, I typically specify higher-than-wall R-value in non-vented cathedral ceilings in cooling dominated climates (although not double), due to higher radiant gains for roof vs walls (due to lower angle of incidence). Note that Clifton is in a heating dominated climate so his approach is appropriate for his climate.
Great article, I really
Great article, I really enjoyed that. What is interesting to me is that a lot of effort is put into building envelop and insulation, but a lot of people don’t put that much thought into picking windows, just get the supply house window with double pane low e. I assume that if the same heat flow calculations were applied to windows, then we would see the same type of horizontal asymptote as the U-value decreases with great gains on the front end. Looking at your graph, it seems to me that a large benefit could be gained by switching from a U of 0.33 (r3) to a U of 0.20 (r5). Is my thinking accurate? You should do a similar article relating to windows.
Great blog,Thanks!
@William, at first glance it
@William, at first glance it seems logical that R5 windows should pencil out in most climates. But windows have a high cost per ft2 (compared to walls), and the jump in cost from R3 to R5 is large enough to make R3 windows a better value in many cases. Also, in warm-to-hot climates, it’s more about SHGC and shading than u-value, since the delta-T is much smaller than in a cold climate.
@Mark, I agree the standard
@Mark, I agree the standard would be better if referenced to lineal feet of frame rather than area. And I certainly agree codes and standards often involve sub-optimal compromises. And yes, double hungs (typically) have higher leakage numbers. But my point was that if a window meets the standard, it’s not going to be a significant contributor to overall building infiltration as a percentage. Unless of course you’re talking about a passive house that tests out well below 1 ACH50.
Case in point. My home, which has volume of 25.5k ft3, tested out at 2.8 ACH50. Pretty tight for a production home. Now I don’t have a test report for my windows, or even if they’re 283E compliant. But let’s assume the worst case, that they test out just under the 0.3 ft2 threshold. In that case, they would contribute well under 10% of total leakage in my home. The percentage would be even less in less-tight homes.
As for the impact on ACH… I don’t know the 75 to 50 conversion offhand, but we’re talking less than 0.25 ACH50 in my home.
Perhaps all those leaky windows you’re referring to don’t meet the standard?
The Physics of Recommended
The Physics of Recommended Insulation Levels in the U.S. have never mattered, why would it matter today? They are set by politicians, Certainteed, & U.S. Corning Glass. Enough said!
Mr. Bailes. You come highly
Mr. Bailes. You come highly recommended. I know very little about R-Values. I live in Huntsville, Al but do not know my “climate zone”. I considering retaining a installation installer for my home (15 year old 1 story, 3,400SF). House currently has about R15 blown installation. He is recommending an additional R-19. Comments?
Thanks for your articles,
Thanks for your articles, Allison. I am new to your site and am learning a lot. Could you or one of the other readers explain why, in the formula for heat flow over a heating season, the UA x HDD value is multiplied by 24? This confuses me, since it seems that the annual HDD is already a deltaT x time value. Is the 24 for hours/day? Or what? Thank you!
Don J.:
Don J.: Yes, it’s just a conversion factor to go from the days in heating degree days to hours in BTU/hr.
For more on degree days, see my articles on that topic:
The Fundamentals of Heating and Cooling Degree Days, Part 1
The Fundamentals of Heating and Cooling Degree Days, Part 2
.