Nest Thermostat Data Unveiled at ACI Conference
 The Nest thermostat has been around since October 2011, quietly collecting data on how your home — and the homes of hundreds of thousands of your neighbors — operates. It gathers information about indoor temperature, relative humidity, air conditioner runtime, auxiliary heat operation for heat pumps, and much more. Unlike the Ecobee thermostat, however, Nest doesn’t let its owners see all those data (which is a problem only for energy geeks really). Enter Michael Blasnik.
The Nest thermostat has been around since October 2011, quietly collecting data on how your home — and the homes of hundreds of thousands of your neighbors — operates. It gathers information about indoor temperature, relative humidity, air conditioner runtime, auxiliary heat operation for heat pumps, and much more. Unlike the Ecobee thermostat, however, Nest doesn’t let its owners see all those data (which is a problem only for energy geeks really). Enter Michael Blasnik.
Blasnik, a building science and data guru, consulted on the Nest while it was under development and after its release. He has since joined the Nest team and is now a Google employee, and he’s been having a lot of fun looking at the data and trying to understand what they’re saying.
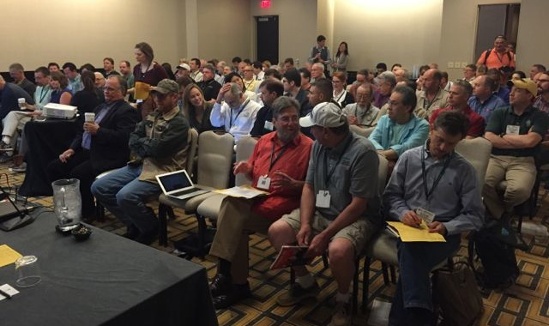
At the ACI conference in New Orleans last week, he gave attendees a first look at some of those data, and my, what a treasure trove he’s got his hands on! The room was packed, as you can see below. I took that photo a few minutes before the session began. After it started, a lot of people were standing in the back as well, and I’m sure many decided to go to a different session because they couldn’t get in.
So let’s get into the data. Blasnik showed 60 graphs of data, and I didn’t take pictures of all of them. Below are the ones that seemed most interesting to me. (It’s really hard to try to take notes, take pictures, and think about what you’re seeing all at the same time.)
Heating setpoints and temperature float
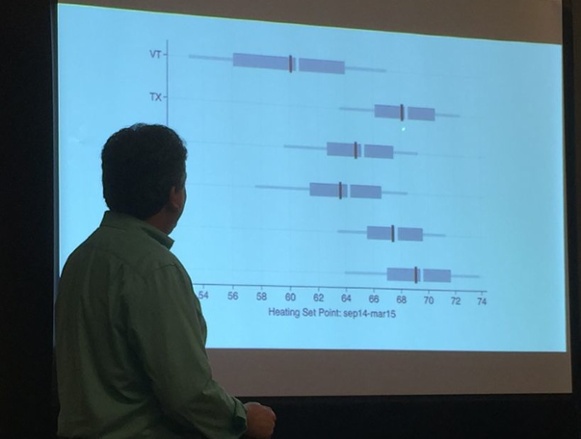
The chart below shows thermostat setpoints during heating season in a few select states. Vermont won for lowest setting at about 60° F. I don’t have a photo, but he also showed heating systems in use by time of year and outdoor temperature. I think Vermont won that one, too, in terms of lowest outdoor temperature before turning on heating systems, but I didn’t get a photo. I do recall there was a small bump of people turning on heating systems when the temperature in Vermont dropped to the 50s (?), and Mike Rogers of Omstout Consulting, a Vermonter, said, “Those are the New Yorkers.”
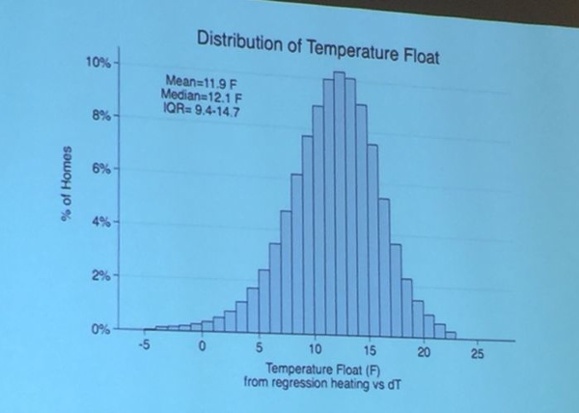
The graph below shows a really interesting fact about heating degree days. The temperature float referred to there is the difference between indoor temperature and outdoor temperature when the heating system comes on. If the thermostat is set to 70° F, for example, the average home’s heating system doesn’t kick on until the outdoor temperature is 58° F. So there’s your average base temperature for heating degree days, at least for homes with Nest thermostats.
Air conditioner runtime and temperature
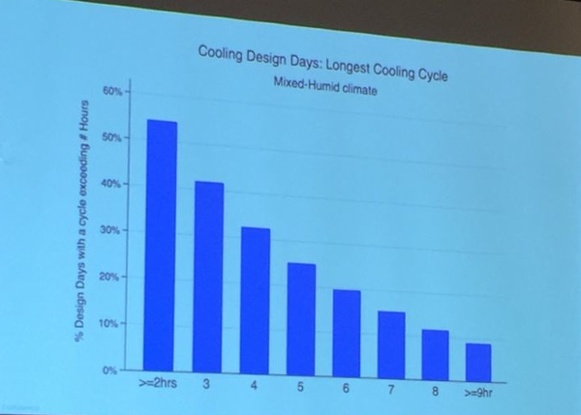
The Nest, of course, monitors air conditioner (and heating system) runtime. That’s the main statistic that owners get in their monthly report. The chart below shows data on the length of air conditioner runtime on design days. A little over half of the homes have runtimes that last at least two hours. About a third of the homes have four hour runtimes. Only about 10% of the homes have runtimes that last eight hours or more, which means they’re basically running continuously through the hottest part of the day.
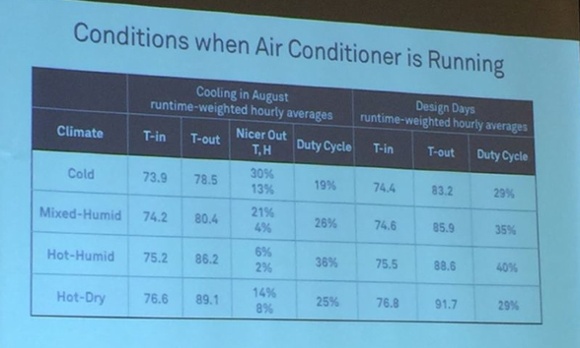
More interesting, though, is what’s happening with the indoor and outdoor temperatures when the AC is running. Look at the fourth column. The top number is the percentage of runtime hours that occur when the outdoor temperature is lower than the indoor temperature.
Notice that in cold climates this happens 30% of the time. Not too surprising since they’re probably the same people who say Atlanta is hot and muggy when they move to the South. (No, Houston, New Orleans, and Tampa are hot and muggy. Atlanta has a really nice climate!) What did surprise me is that it’s 21% in mixed-humid climates. Yes, right here in Atlanta, the average Nest thermostat owner runs their AC one out of each five hours when it’s nicer outdoors than indoors. Hmmm.
If that seems a little odd and wasteful, consider the second number in that column. It shows the enthalpy difference between indoors and outdoors, which captures the effect of humidity, too. Notice that an AC in a mixed-humid climate runs only 4% of the time when it’s nicer outside than inside based on temperature and humidity, so it’s not as bad as it looks based on temperature only.
Air conditioner runtime and humidity
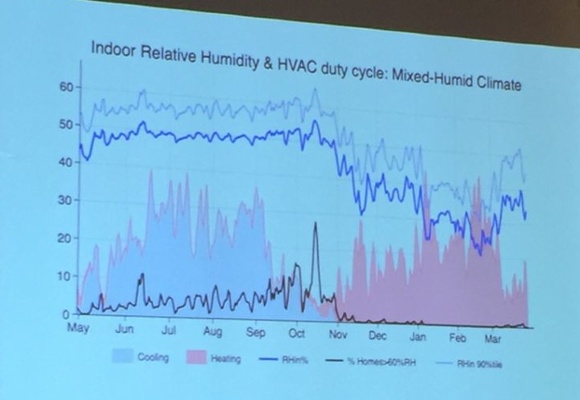
The graph below is a bit confusing, but if you spend some time with it, you’ll reap the benefits. It shows when heating and cooling are happening throughout the year, how the indoor relative humidity changes, the relative humidity in the 90th percentile of homes, and what percentage of homes have humidity above 60%.
Notice that spike in homes with humidity above 60% that occurs in October? It seems to support something I wrote a few years ago: Why Is Fall a Good Time of Year for Window Condensation?
The next three graphs show indoor relative humidity as a function of air conditioner runtime. The results may challenge your beliefs and call into question what we’ve been teaching for a long time now, so you may want to sit down before taking a look.
Ready? Here’s the first one. These are all for homes in Charlotte, North Carolina, a mixed-humid climate.
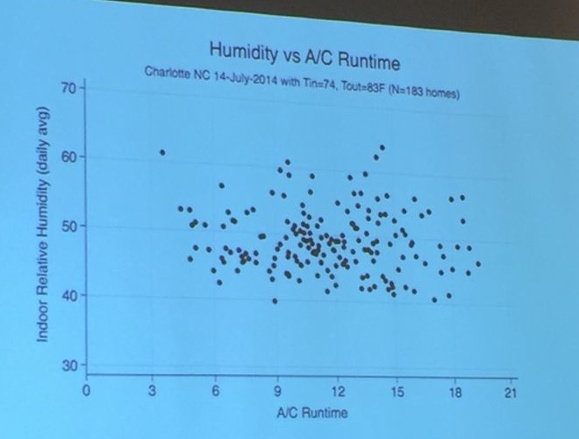
See the trend? Neither do I. There’s no pattern there, just a scattering of data points all over the graph. But this was just for a single day, 14 July 2014, so we probably just need to look at more days, right? How about these?
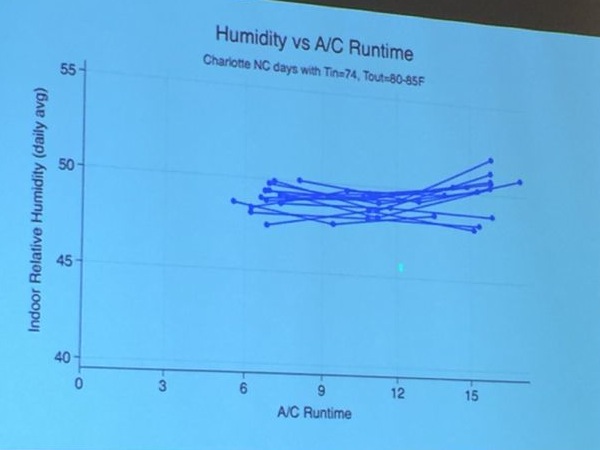
Hmmm. Most of us in the world of building science have been preaching the gospel of AC runtime as a the cure for high indoor relative humidity. The data above, for warm days in a mixed-humid climate, provide no evidence that what we’re saying is correct.
In fact, if there’s a trend in those data above at all, it’s the opposite: Higher AC runtime results in higher indoor relative humidity. It’s not a strong trend in that direction, but still, even if it’s flat, it’s not what we expect to see.
The slide below shows data for four different temperature ranges, and it’s not until you get to the mild days with temperatures between 65 and 75° F that we see the trend we expect. What the heck is going on here?!
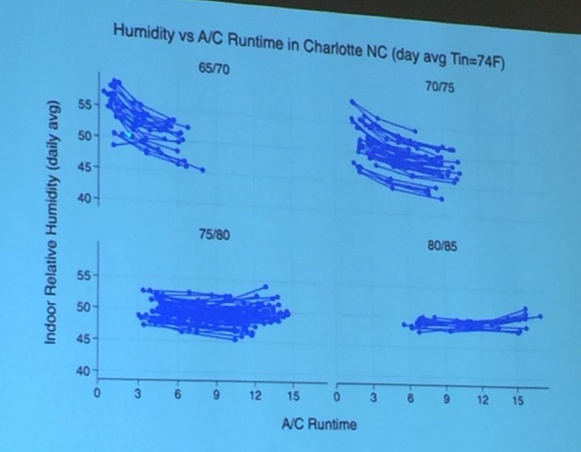
Of course, runtime and indoor relative humidity are only two variables that factor into the question of air conditioner performance. One thing that HVAC systems with air distribution can do is change the pressures inside the house. Unbalanced duct leakage can bring more outdoor air into the house, and that could be what’s happening here. We know the typical home has leaky ducts. We also don’t know anything about how tight the building enclosure of these homes is. What we’re seeing above is an average of what’s going on in a whole lot of homes, so we really can’t draw any conclusions yet.
Blasnik showed similar data sets for other cities: Houston and Dallas (about 1000 homes each), Minneapolis, Washington, DC, and more. The Houston and Dallas data showed the same patterns as Charlotte. Minneapolis did show a decreasing trend on the hot days, which Gary Nelson, founder of The Energy Conservatory, said was probably because the ducts are inside the building enclosure there.
The takeaways from these data for Blasnik were that air conditioners are doing a pretty good job with latent control and there’s no real evidence of oversizing based on the runtime data he’s looked at. Also, very few homes went above 60% relative humidity, and even in the places where the curve is flat, the relative humidity is around 50%, which is right where you want to be.
Heat pump auxiliary heat
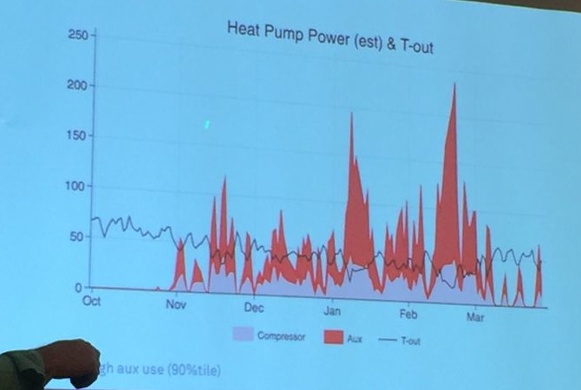
I’ll close with a couple of Blasnik’s slides on electric resistance auxiliary heat (strip heat) use in heat pumps. The first one shows huge opportunities for saving money and energy for homeowners. It’s the top 10% of strip heat users, and according to Blasnik, they were burning an incredible 240 kilowatt-hours per day on the coldest days. Wow! (I’ve written about how common it is for heat pumps to run strip heat when they shouldn’t.)
The graph below shows strip heat use for all heat pump owners. You can see that in the median homes (represented by the black line), the heat pump’s supplemental heat kicks on at about 40° F. The worst homes are using strip heat at outdoor temperatures above 60° F. (I wonder how low the heating degree day base temperature might be if the worst homes were excluded.)
The best 25% of homes are getting only about 10% of their heat from the strips even when the temperature is down at 10° F. Blasnik also threw out some numbers about the low temperatures they’ve seen where some homes are still getting 100% from the heat pump, but I didn’t write them down. D’oh!
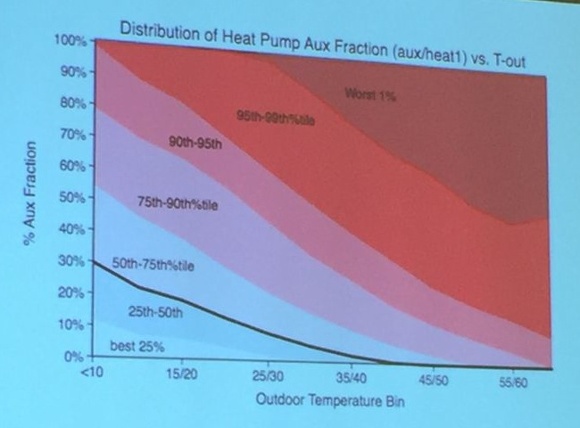
(I’m afraid Edward Tufte would not approve of this graph, but to be fair, Blasnik admitted that he struggled with finding a good way to present these data and the rest of his graphs are great. The shaded regions give the false impression that their areas represent the number of homes subject to those conditions. That is an incorrect impression, however, as the number of homes contributing to the data below the black line is equal to the number included above the black line. For more on this topic, buy yourself a copy of Tufte’s excellent book, The Visual Display of Quantitative Information.)
A great start
The data that Blasnik showed us at the ACI conference were astounding. When I was talking to him afterward, he said they have enough data for a dozen or more grad students to write doctoral disserations on. Let’s hope Nest will release them. Even better, give us a searchable database!
But let’s also give props to Nest for collecting the data and letting Michael share some of them with us at ACI. Whether you have a Nest thermostat or not, these data can help everyone by adding to our understanding of how homes really work.
5/13/15 Note: I’ve updated this article with some additional information since its first publication on 5/12/15.
Related Articles
We Are the 99% — Design Temperatures & Oversized HVAC Systems
This Thermostat Setting Can Cost You Money and Make You Sick
A Surprisingly Common Cause for High Energy Bills
NOTE: Comments are moderated. Your comment will not appear below until approved.
This Post Has 36 Comments
Comments are closed.
As we gain more understanding
As we gain more understanding of human comfort and equipment operation through data like this we’ll be able to build better buildings, simple as that. Great stuff!
This data just backs up what
This data just backs up what BSC has been saying since 2009: "The best HVAC system is one that has discrete <br />components that individually fulfill each of these functions. This allows each sub-system to be optimized <br />for its function, and a control system can also easily be implemented to operate each function optimally with <br />none of the compromises or trade-offs inherent in multirole components. <br />The most dysfunctional, difficult to control systems combine multiple functions into one device. Although <br />popular, these systems also often consume the most energy." (BSI-022_Perfect_HVAC) Trying to provide adequate heating/cooling/humidity levels/ventilation comfort using a single system based on a single control (air temperature) makes no sense. <br />And all the extensive research on human comfort has already been done by Robert Bean’s group (see http://www.healthyheating.com).
Great coverage of the session
Great coverage of the session, Allison! The missing confounding variable is ACH. So much more information about when heating or cooling systems are turned on would very likely find a correlation to ACH. Nest could request owners volunteer that data in the form of CFM50, floor area, ceiling height and number of stories. Even if only 10% of Nest owners submitted this information, it would help parse the data into more meaningful graphs. <br /> <br />I think the humidity vs run-time scatter plot would show a definite trend if we knew the envelope leakage and duct leakage. What was the outdoor relative humidity? Does longer run-time mean the system is sized right, improperly charged, or that the house is leaky? If it’s the latter two, humidity may not drop appreciably. <br /> <br />Mr. Blasnik does a great job analyzing data, but I’m sure he’d like to know more about the house characteristics to fully understand how we control our indoor environment.
IMHO, the premise that longer
IMHO, the premise that longer run times do not equal lower humidity based on the data is simply flawed. There is too much missing data to even begin thinking that it is the issue. For example what type of units, where are the ducts (returns in the attic or crawl…), what is the outdoor humidity, what type of ventilation / how long is it running, are the drain pans actually draining, has a unit frozen or person left fan on, etc… That doesn’t even get to how leaky is the house, is everyone congregating indoors, using bath & kitchen exhausts, etc… <br />A far better chart would be looking at Ductless Mini-split systems with no other ventilation system running – Now we can start talking. Based on the chart above the question really isn’t about run-time but where is the moisture coming from. Of course with most people thinking 60% is good, it doesn’t take much to spike above it. <br />
Wish I was there for that one
Wish I was there for that one, Allison. <br /> <br />Here’s one idea that might explain the runtime vs. daily average RH% graph for the four different temperature "bins": duct leakage. <br /> <br />On the same graph, it’s interesting to note that none of the houses exceeded 60%RH…and on days approaching/exceeding design days (80-85F bin), there’s a remarkable consistency in RH%…floating just under 50% at 74F average indoor temperature for all but the highest run-times….if anything, these systems are removing TOO MUCH moisture when it’s hot/humid outside.
Allison <br /
Allison <br /> <br />Let me know if you have access to any data for Louisiana or Texas. If not hope to see more translation of available data or anything researched verified and posted to www Also the scatter plot was statistically saying 64.5 percent, lol. Without knowing all factors explained clear as mud agreed.
<b>Ken R.</b>: I
<b>Ken R.</b>: I agree! <br /> <br /><b>David E.</b>: True. Henry Gifford said the same thing when I heard him speak a few years ago: <a href="http://energyvanguard.com/blog-building-science-HERS-BPI/bid/54771/Don-t-Do-HVAC-to-Me"><i>Don't Do HVAC to Me</i></a>. The two biggest drawbacks, however, are cost and space. <br /> <br /><b>Dale S.</b>: Indeed! I’d meant to mention those other factors, but in my haste to get the article published this morning, that slipped my mind. I’ve added another paragraph about duct and enclosure leakage. Thanks for bringing that up. <br /> <br /><b>Sean</b>: Great points. See my comment to Dale. <br /> <br /><b>John S.</b>: Great points. Gary Nelson raised the issue of duct leakage at the presentation. <br /> <br /><b>Ken B.</b>: Nest has data for all the climates where people have installed their thermostats, including the hot-humid climate of Texas and Louisiana. The problem is they’re holding onto them right now. <br />
Given the runtime vs humidity
Given the runtime vs humidity plot was in Charlotte with the number of houses a low 183 and the unknowns, I would still speculate that air handlers and flex ductwork in unconditioned attics and crawlspaces, common in that area, are a big issue. <br /> <br />However the biggest problem, as you noted, is the "Aux" heat plot. Hopefully the data is not flawed; the Nest heat pump aux lockout defaults to "Max Comfort" which turns on Aux heat at "a higher AUX lockout temp", typically 40F or higher. <br /> <br />It would seem the upper 50% of the 183 units with a Nest in Charlotte have older and poorly maintained heat pumps. Almost all standard heat pumps can’t keep up easily below 40F when real world derating factors such as space installation practices, poor sealing of the air handlers, one inch filters quickly clogging coils, coil leaks and low refrigerant levels are considered. <br /> <br />Most installation and repair techs still rely on analog gauges without consideration of wet bulb temperatures and calculated superheat and subcooling to ensure a proper charge. Many older "high efficiency" systems have experienced an epidemic of slowly leaking evaporator coils that are simply recharged when they fail to function. <br /> <br />The room for improvement in Aux heat management and tech practices is enormous. However the core of these kinds of installations is usually the builder while HVAC manufacturers are responsible for failing coils. Instead of mandates for lighting perhaps it’s time for HVAC regulations and not just manufacturer’s lab controlled SEER ratings.
<b>Richard P</b>:
<b>Richard P</b>: Yes, I think the strip heat running too much in heat pumps is a much bigger problem, too. I think you’re assuming a smaller data set than they represent, though. Blasnik showed a lot of data from a lot of climate zones, and some of the slides, I believe, were for hundreds of thousands of homes. I’m not sure how many homes were included in those last two slides, but I’m sure it’s more than the 183 homes used in the Charlotte humidity data.
As we gain more understanding
As we gain more understanding of human comfort and equipment operation through data like this we’ll be able to build better buildings, simple as that. Great stuff!
This data just backs up what
This data just backs up what BSC has been saying since 2009: “The best HVAC system is one that has discrete
components that individually fulfill each of these functions. This allows each sub-system to be optimized
for its function, and a control system can also easily be implemented to operate each function optimally with
none of the compromises or trade-offs inherent in multirole components.
The most dysfunctional, difficult to control systems combine multiple functions into one device. Although
popular, these systems also often consume the most energy.” (BSI-022_Perfect_HVAC) Trying to provide adequate heating/cooling/humidity levels/ventilation comfort using a single system based on a single control (air temperature) makes no sense.
And all the extensive research on human comfort has already been done by Robert Bean’s group (see http://www.healthyheating.com).
Great coverage of the session
Great coverage of the session, Allison! The missing confounding variable is ACH. So much more information about when heating or cooling systems are turned on would very likely find a correlation to ACH. Nest could request owners volunteer that data in the form of CFM50, floor area, ceiling height and number of stories. Even if only 10% of Nest owners submitted this information, it would help parse the data into more meaningful graphs.
I think the humidity vs run-time scatter plot would show a definite trend if we knew the envelope leakage and duct leakage. What was the outdoor relative humidity? Does longer run-time mean the system is sized right, improperly charged, or that the house is leaky? If it’s the latter two, humidity may not drop appreciably.
Mr. Blasnik does a great job analyzing data, but I’m sure he’d like to know more about the house characteristics to fully understand how we control our indoor environment.
I wonder if Nest is doing any
I wonder if Nest is doing any actual blower door testing on a few sample homes to dive deeper on these questions…?
IMHO, the premise that longer
IMHO, the premise that longer run times do not equal lower humidity based on the data is simply flawed. There is too much missing data to even begin thinking that it is the issue. For example what type of units, where are the ducts (returns in the attic or crawl…), what is the outdoor humidity, what type of ventilation / how long is it running, are the drain pans actually draining, has a unit frozen or person left fan on, etc… That doesn’t even get to how leaky is the house, is everyone congregating indoors, using bath & kitchen exhausts, etc…
A far better chart would be looking at Ductless Mini-split systems with no other ventilation system running – Now we can start talking. Based on the chart above the question really isn’t about run-time but where is the moisture coming from. Of course with most people thinking 60% is good, it doesn’t take much to spike above it.
Wish I was there for that one
Wish I was there for that one, Allison.
Here’s one idea that might explain the runtime vs. daily average RH% graph for the four different temperature “bins”: duct leakage.
On the same graph, it’s interesting to note that none of the houses exceeded 60%RH…and on days approaching/exceeding design days (80-85F bin), there’s a remarkable consistency in RH%…floating just under 50% at 74F average indoor temperature for all but the highest run-times….if anything, these systems are removing TOO MUCH moisture when it’s hot/humid outside.
Allison
Allison
Let me know if you have access to any data for Louisiana or Texas. If not hope to see more translation of available data or anything researched verified and posted to www Also the scatter plot was statistically saying 64.5 percent, lol. Without knowing all factors explained clear as mud agreed.
Ken R.: I
Ken R.: I agree!
David E.: True. Henry Gifford said the same thing when I heard him speak a few years ago: Don’t Do HVAC to Me. The two biggest drawbacks, however, are cost and space.
Dale S.: Indeed! I’d meant to mention those other factors, but in my haste to get the article published this morning, that slipped my mind. I’ve added another paragraph about duct and enclosure leakage. Thanks for bringing that up.
Sean: Great points. See my comment to Dale.
John S.: Great points. Gary Nelson raised the issue of duct leakage at the presentation.
Ken B.: Nest has data for all the climates where people have installed their thermostats, including the hot-humid climate of Texas and Louisiana. The problem is they’re holding onto them right now.
Given the runtime vs humidity
Given the runtime vs humidity plot was in Charlotte with the number of houses a low 183 and the unknowns, I would still speculate that air handlers and flex ductwork in unconditioned attics and crawlspaces, common in that area, are a big issue.
However the biggest problem, as you noted, is the “Aux” heat plot. Hopefully the data is not flawed; the Nest heat pump aux lockout defaults to “Max Comfort” which turns on Aux heat at “a higher AUX lockout temp”, typically 40F or higher.
It would seem the upper 50% of the 183 units with a Nest in Charlotte have older and poorly maintained heat pumps. Almost all standard heat pumps can’t keep up easily below 40F when real world derating factors such as space installation practices, poor sealing of the air handlers, one inch filters quickly clogging coils, coil leaks and low refrigerant levels are considered.
Most installation and repair techs still rely on analog gauges without consideration of wet bulb temperatures and calculated superheat and subcooling to ensure a proper charge. Many older “high efficiency” systems have experienced an epidemic of slowly leaking evaporator coils that are simply recharged when they fail to function.
The room for improvement in Aux heat management and tech practices is enormous. However the core of these kinds of installations is usually the builder while HVAC manufacturers are responsible for failing coils. Instead of mandates for lighting perhaps it’s time for HVAC regulations and not just manufacturer’s lab controlled SEER ratings.
Richard P:
Richard P: Yes, I think the strip heat running too much in heat pumps is a much bigger problem, too. I think you’re assuming a smaller data set than they represent, though. Blasnik showed a lot of data from a lot of climate zones, and some of the slides, I believe, were for hundreds of thousands of homes. I’m not sure how many homes were included in those last two slides, but I’m sure it’s more than the 183 homes used in the Charlotte humidity data.
So, how do we use this
So, how do we use this information. It’s like doing an energy audit without a Blower Door. Some information is interesting, but it could be very misleading. We just don’t know. But I’m Google will find an economic value to this information, if we can’t.
Fascinating datasets. I’m
Fascinating datasets. I’m glad NestLabs hired someone to dig into the data. <br /> <br />I am recovering Heat Pump user who gave up on the Nest a year ago, after a year of bad algorithms and interface bugs led me to use a bunch more aux than my other tstats used. <br /> <br />Back then, I talked to Nest mgmt extensively, and they were **clueless** about their problems and UI bugs. <br /> <br />They publish white-papers about this data from time to time, and it is clear that the Nest DOES save energy for most users, but heat pump users have problems, including blown compressors, higher energy usage, etc.
So, how do we use this
So, how do we use this information. It’s like doing an energy audit without a Blower Door. Some information is interesting, but it could be very misleading. We just don’t know. But I’m Google will find an economic value to this information, if we can’t.
Fascinating datasets. I’m
Fascinating datasets. I’m glad NestLabs hired someone to dig into the data.
I am recovering Heat Pump user who gave up on the Nest a year ago, after a year of bad algorithms and interface bugs led me to use a bunch more aux than my other tstats used.
Back then, I talked to Nest mgmt extensively, and they were **clueless** about their problems and UI bugs.
They publish white-papers about this data from time to time, and it is clear that the Nest DOES save energy for most users, but heat pump users have problems, including blown compressors, higher energy usage, etc.
Do you know the sample size
Do you know the sample size of homes included in these datasets? It’s all homes that use a NEST, right? What order of magnitude are we talking here? Several thousand? Tens of thousands? <br /> <br />Is there a potential to be some kind of bias in the type of building envelope likely to be present in a home that uses a NEST thermostat? I don’t think that would be very easy to tease out if so, but there may be trends as far as the kind of consumer likely to put a NEST in and kind of attention they might have paid to various aspects of their building envelope.
I’m very thankful Michael
I’m very thankful Michael Blasnik got Nest to allow this data to be presented. <br /> <br />Echoing Andrew McDowell, the next question is how can we use this information to help consumers? How can we sell more jobs with it? <br /> <br />This is off topic a touch, but at the ACI keynote less than 10% of people raised their hands when asked who was a contractor. There is a sales problem behind that. All the specialized knowledge in the world doesn’t matter than much until it’s applied in the marketplace. Food for thought.
Switching gears to a Building
Switching gears to a Building Science perspective, while the RH and run time bit is interesting, there is a lot we don’t know as Dale S. and Sean L. commented. <br /> <br />The biggest factor there is probably duct connections to the outdoors. In your experiment on your own family, Allison, you found that running the fan bumped RH because it sucked in more outside humidity through leaky ducts. <br /> <br />Could the same be true here even with equipment running: duct leakage to outdoors pulls in more moisture than the equipment takes out? <br /> <br />I’d be curious how the numbers hold in a reasonably tight home with reasonably tight ducts. Crappy houses perform crappily…
Do you know the sample size
Do you know the sample size of homes included in these datasets? It’s all homes that use a NEST, right? What order of magnitude are we talking here? Several thousand? Tens of thousands?
Is there a potential to be some kind of bias in the type of building envelope likely to be present in a home that uses a NEST thermostat? I don’t think that would be very easy to tease out if so, but there may be trends as far as the kind of consumer likely to put a NEST in and kind of attention they might have paid to various aspects of their building envelope.
I’m very thankful Michael
I’m very thankful Michael Blasnik got Nest to allow this data to be presented.
Echoing Andrew McDowell, the next question is how can we use this information to help consumers? How can we sell more jobs with it?
This is off topic a touch, but at the ACI keynote less than 10% of people raised their hands when asked who was a contractor. There is a sales problem behind that. All the specialized knowledge in the world doesn’t matter than much until it’s applied in the marketplace. Food for thought.
Switching gears to a Building
Switching gears to a Building Science perspective, while the RH and run time bit is interesting, there is a lot we don’t know as Dale S. and Sean L. commented.
The biggest factor there is probably duct connections to the outdoors. In your experiment on your own family, Allison, you found that running the fan bumped RH because it sucked in more outside humidity through leaky ducts.
Could the same be true here even with equipment running: duct leakage to outdoors pulls in more moisture than the equipment takes out?
I’d be curious how the numbers hold in a reasonably tight home with reasonably tight ducts. Crappy houses perform crappily…
Thank you Allison for posting
Thank you Allison for posting this. The "conditions when the air conditioner is running" slide makes me wonder if "residential economizers" might make more sense now? As I understand it, residential economizers were thought to never be cost effective as residential loads are driven by envelope loads not internal loads as it typically is in the commercial sector. But these new data makes me wonder. From my experience, my clients in cold climates overuse their AC because of comfort – they HATE being the slightest bit hot, but can tolerate 60F indoor dry bulb all winter – (like Vermont). For cold climates, it seems like economizers (or windows) might work. Or, now that more and more homes have mechanical ventilation, some control scheme were more ventilation is added when outside T is lower than inside T instead of firing up the condenser (or the windows are opened :-). <br />For cold climates, these numbers (30%, 13%) could lead to real savings. Was this discussed? Any thoughts?
Thank you Allison for posting
Thank you Allison for posting this. The “conditions when the air conditioner is running” slide makes me wonder if “residential economizers” might make more sense now? As I understand it, residential economizers were thought to never be cost effective as residential loads are driven by envelope loads not internal loads as it typically is in the commercial sector. But these new data makes me wonder. From my experience, my clients in cold climates overuse their AC because of comfort – they HATE being the slightest bit hot, but can tolerate 60F indoor dry bulb all winter – (like Vermont). For cold climates, it seems like economizers (or windows) might work. Or, now that more and more homes have mechanical ventilation, some control scheme were more ventilation is added when outside T is lower than inside T instead of firing up the condenser (or the windows are opened :-).
For cold climates, these numbers (30%, 13%) could lead to real savings. Was this discussed? Any thoughts?
There is no question that
There is no question that running a coil in cool mode will lower the humidity even in a very leaky house. This is easily demonstrated down south and has been for decades even with mercury bulb thermostats. <br /> <br />However indoor units installed in crawl spaces and attics are guaranteed to be very leaky; this is SOP by builders in the south and the midwest. Running the air handler fan continuously or in a random circulating mode (recently enabled by smart thermostats)is also common which will always dry out a normally wet evaporator coil increasing the humidity. <br /> <br />Finally I have seen more homeowners buy Nest thermostats simply for the remote control, cool factor and a perceived "savings" (rarely demonstrated)while employing them with bad hvac installs, low refrigerant, dirty coils and leaky envelopes.
There is no question that
There is no question that running a coil in cool mode will lower the humidity even in a very leaky house. This is easily demonstrated down south and has been for decades even with mercury bulb thermostats.
However indoor units installed in crawl spaces and attics are guaranteed to be very leaky; this is SOP by builders in the south and the midwest. Running the air handler fan continuously or in a random circulating mode (recently enabled by smart thermostats)is also common which will always dry out a normally wet evaporator coil increasing the humidity.
Finally I have seen more homeowners buy Nest thermostats simply for the remote control, cool factor and a perceived “savings” (rarely demonstrated)while employing them with bad hvac installs, low refrigerant, dirty coils and leaky envelopes.
<br />All I
<br />All I can say is that Nest called 20-30% aux in my well sealed, tight ducted HP house with new split HP, when the outdoor temp was in the 30s (which are a lot of hours in my mid-atlantic climate), yet my balance point is 22-23°F. <br /> <br />My old Honeywell VisionPro never called aux above 25°F. My Ecobee has a lockout there, and no problems. <br /> <br />The interesting question for Blasnik re the last graphs showing aux usage is how much of the problem is the HP and how much is the controller….the Nest. <br /> <br />If you see the home using a huge amount of aux, but the compressor is only running 10 hours a day….I think that is a smoking gun at the nest. <br /> <br />Typical day in the 30s, my nest would run my compressor for 15 hours/day, and call a lot of aux. The other stats would run the compressor 20 hours and no aux. Below balance point, the Honeywell would run the HP 100% duty, and strobe the aux, the Ecobee runs ~95% cycle, and the nest ran an 80% duty cycle on the HP, making up the lost output with more aux. <br /> <br />Seems like a pretty easy analysis for Blasnik to do, HP cycle time versus temp. <br /> <br />He could regress HP and aux runtime versus outdoor temps (and clean up the data by cutting high outdoor wetbulb). And then compute a balance point for each system, and determine how much aux nest was calling above, say balance point+5°F. That is, how much is totally wasted by defects in the control algorithm. <br /> <br />And then prob get fired.
All I
All I can say is that Nest called 20-30% aux in my well sealed, tight ducted HP house with new split HP, when the outdoor temp was in the 30s (which are a lot of hours in my mid-atlantic climate), yet my balance point is 22-23°F.
My old Honeywell VisionPro never called aux above 25°F. My Ecobee has a lockout there, and no problems.
The interesting question for Blasnik re the last graphs showing aux usage is how much of the problem is the HP and how much is the controller….the Nest.
If you see the home using a huge amount of aux, but the compressor is only running 10 hours a day….I think that is a smoking gun at the nest.
Typical day in the 30s, my nest would run my compressor for 15 hours/day, and call a lot of aux. The other stats would run the compressor 20 hours and no aux. Below balance point, the Honeywell would run the HP 100% duty, and strobe the aux, the Ecobee runs ~95% cycle, and the nest ran an 80% duty cycle on the HP, making up the lost output with more aux.
Seems like a pretty easy analysis for Blasnik to do, HP cycle time versus temp.
He could regress HP and aux runtime versus outdoor temps (and clean up the data by cutting high outdoor wetbulb). And then compute a balance point for each system, and determine how much aux nest was calling above, say balance point+5°F. That is, how much is totally wasted by defects in the control algorithm.
And then prob get fired.
I wonder if Nest is doing any
I wonder if Nest is doing any actual blower door testing on a few sample homes to dive deeper on these questions…?