Stockton Project Demonstrates Huge Home Energy Savings
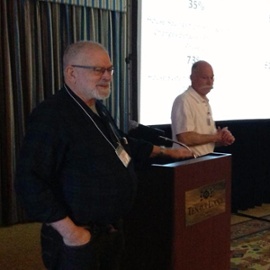
 At the Forum on Dry Climate Home Performance earlier this year, I got to hear three building science experts talk about a really cool research project they’ve been working on in Stockton, California. Bruce Wilcox, John Proctor, and Rick Chitwood (Wilcox and Proctor shown in photo at left) filled us in on the Stockton project, which now has two years of data and shows some really impressive results.
At the Forum on Dry Climate Home Performance earlier this year, I got to hear three building science experts talk about a really cool research project they’ve been working on in Stockton, California. Bruce Wilcox, John Proctor, and Rick Chitwood (Wilcox and Proctor shown in photo at left) filled us in on the Stockton project, which now has two years of data and shows some really impressive results.
The four houses
The research team opened their work by finding four suitable houses to use in the project. They’ve got a relatively new house built in 2005 that’s pretty much at the level of their current energy code. Then they’ve got houses that get progressively worse as you go back in time. They were built in 1996, 1953, and 1948, and as you might expect, the three older houses showed much greater savings than the 2005 house. Here’s a table of the basic data:
| House | Year Built | Size |
| Caleb | 2005 | 2076 sf |
| Fidelia | 1990 | 1690 sf |
| Mayfair | 1953 | 1104 sf |
| Grange | 1948 | 852 sf |
What they did in the homes was to set them up to collect a year’s worth of data before they made any improvements. All the homes were unoccupied, but the researchers set them up for simulated occupancy. What that means is they automated the controls in each house to run the HVAC and other systems similarly to the way real occupants would.
They also wired up the homes with dataloggers and sensors to collect as much data about the energy use and environmental conditions as they thought might be helpful. They collected indoor temperature, outdoor temperature, wind, incident solar radiation, HVAC power use, relative humidity, when the thermostat was calling for conditioned air, and more.
First, let’s take a look at what I think is the most interesting part of their work.
Quantifying the attic HVAC penalty
One of the best aspects of this research project was how they quantified the penalty for putting the HVAC system in the attic. I wrote a few years ago about a study from the National Renewable Energy Lab (NREL) showing that ducts in the attic result in more energy use and larger air conditioning systems. What they found in this project may surprise you.
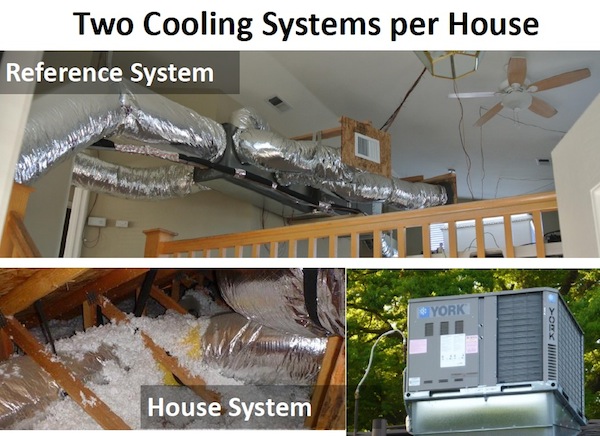
In this study, the team installed a second HVAC system, this one in the conditioned space, so they could compare the energy use to the system in the attic. And since it was their project and they could do what they wanted with the homes, they installed what they called the Reference System right in the living room, hanging from the ceiling, as you see below.
It may not be pretty, but the simulated occupants didn’t mind, despite occasionally bumping their simulated heads into the very real air handler. Just kidding! The researchers simulated their heads so well they never banged them into anything. OK, really just kidding! Painful experience has taught researchers not to give simulated occupants any kind of simulated body and definitely no simulated emotions, all because of that one disastrous project where two simulated occupants fought over the thermostat setting and ended up destroying a whole neighborhood. (Really really just kidding. What do you think this is – The Matrix?)
The way they got an accurate comparison was to run the houses in Flip-Flop mode. They’d run the Reference System for two days, then flip to the House System for two days, then flop back to the Reference System for two days… They also kept track of the outdoor conditions so they could adjust for weather.
Recall that for the first year, they monitored the homes before making any improvements. The graph below shows how much better the Reference System performed than the House System in one of the homes (the Fidelia) before improvements. That graph shows the performance in cooling mode. Another graph shows similar results for heating.
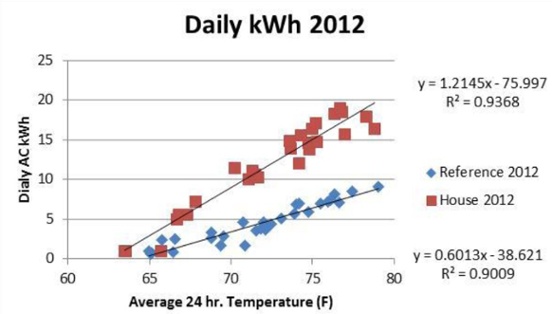
They didn’t report Reference vs. House System results for the Caleb, the newer house, but the results for the three older ones were all similar and are summarized below.
| House/Reference |
House/Reference | |
| House | Before | After |
| Fidelia | 42% | 100% |
| Mayfair | 62% | 95% |
| Grange | 65% | 89% |
What those numbers mean is that before the team made any improvements, the HVAC system in the Fidelia, for example, was using more than twice as much energy as it would have if it had had its HVAC system installed in conditioned space instead of in the attic. That is, since the House System was operating at 42% of the efficiency of the Reference System, it was using 100/42 = 2.4 times the amount of energy. That’s quite a penalty!
The other two houses did better but were still using 1.6 and 1.5 times the energy they would have used with the HVAC in conditioned space.
After the improvements, the numbers are much better. The Fidelia is at 100%, which means the House System was operating at the same efficiency as the Reference System. The way they got it so high was by moving those ducts out of the attic and into a dropped ceiling.
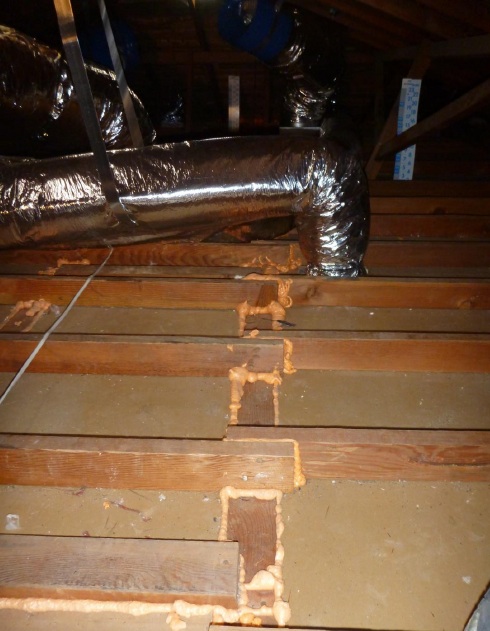
The Mayfair (shown in photo above before new attic insulation) and the Grange showed great improvement but didn’t get all the way to 100% because the ducts were still in the attic but buried under a lot of attic insulation. They estimated the insulation above the ducts to be R-25. (Warning: Burying ducts under attic insulation is fine in a dry climate like California’s but can lead to condensation and water-damaged ceilings in humid climates.)
What did they do and how much did they save?
The improvements they made in the houses were all similar but varied somewhat based on the needs of the house. The newest house got the least work, and what it got was focused almost entirely on the HVAC system. Here’s a summary of the retrofits on the older three houses:
- New high-performance windows – The existing windows were single pane, metal frame in 2 of the houses and double-pane, metal frame in the other.
- Attic insulation
- Mechanical ventilation
- 2 of them got wall insulation (Mayfair and Grange)
In addition, all four houses had their air conditioners reduced in size, their ducts improved, and whole-house fans added for night cooling.
And what was the result of all this? How much did they reduce their energy consumption? A lot! Even the newest house got significant savings. Here are the numbers:
| House | Savings |
| Caleb | 35% |
| Fidelia | 71% |
| Mayfair | 74% |
| Grange | 73% |
The savings shown here are for the HVAC systems only, not all the energy use in the houses. Still, those savings numbers are awesome!
Putting it in perspective
The retrofits done on these homes to reduce their energy consumption were standard retrofits that many homes need: air-sealing, duct-sealing, improving duct air flow, adding insulation, and replacing crappy windows. None of the retrofits went through the expensive deep energy retrofit process of having their walls completely stripped and rebuilt. None of them had exterior insulation added to the walls. None of them got spray foam insulation in the attic.
Yet they’re saving boatloads of energy. The three older houses are now using about a quarter of the energy they formerly used for heating and cooling. Wow!
The research team hasn’t put together the costs of the retrofits yet, but they’re certain to be reasonably low. (My guess is in the twelve to thirty thousand dollar range, but that’s just a guess.)
One of the key elements of this work is getting the HVAC system losses as low as possible. If you look at the details of the improvements they made, you’ll see one of the main things they did was to get the ducts to move more air using less energy. Now do you see why I talk about ducts so much here?
This study, which is entering its third year now, is a great example of the opportunities available for saving energy in existing homes. Or, if you look at it the other way, it’s a look at the tremendous amount of energy wasted in so many existing homes.
Related Articles
Case Closed: Get Those Air Conditioning Ducts out of the Attic
Historic Preservation and Deep Energy Retrofits — Natural Enemies?
What If Home Builders Had to Pay the Energy Bills?
NOTE: Comments are moderated. Your comment will not appear below until approved.
This Post Has 12 Comments
Comments are closed.
Allison,
Allison,
While the % energy savings are impressive it would be of considerable interest to know the $ savings as well.
A link to the Stockton Project data would be informative.
Thanks!
Steve W.:
Steve W.: They didn’t provide actual cost savings in their presentation, but perhaps they will comment here and say something about that. I’m waiting to hear back from them with permission to post a link to download the presentation.
Paul M.: You’re welcome!
I would also be interested in
I would also be interested in the cost-benefit analysis – especially in mild climate/low-cost PG&E; territory. [I’d love to have the “problem” of contending with 63-79 degree seasonal temperature swings!] Too bad the experimenters did not have volunteer residents as qualitative comfort improvements would have been as interesting as the quantitative.
David E.:
David E.: I can’t tell if you’re being facetious or not, but Stockton is in the Central Valley and is definitely not a mild climate. Their cooling design temperature is 97° F. Nor does it have low electric rates. Currently, PG&E; is charging $0.14 to $0.36 per kWh, depending on consumption.
Not facetious at all – just
Not facetious at all – just going by the cooling data above (must have been fairly cool during the testing period if the design temp is 97). My cooling seasonal swings (SE PA) are much larger with much more latent humidity to contend with, and imagine our heating season swings are also much more extreme.
My relatives in the Bay area have PG&E; and their payments are a fraction of what I pay. I did not know PG&E;’s electric/gas rate; might be that their microclimate is much more mild than Central Valley or that their specific utility rates are lower. IDK
Still am interested in this specific project’s cost/benefit analysis.
It would be interesting to
It would be interesting to see energy usage from a house built before 1920. The wall cavity in those homes creates a great opportunity to see a remarkable difference once the upgrades (wall insulation among others) were made.
David E.:
David E.: Ah, I see. The graph above shows the 24 hour average temperature, so that’s where the confusion entered. Even in July, Stockton’s average low temperature is 59° F because it’s so dry, so the 24 hour average temperature on a design day is going to be in the 70s. You’re right about winter, though. They are pretty mild there.
Ryan R.: Two of the houses above did get their walls insulated. The Mayfair had no wall insulation, and the Grange had only foil insulation.
The link to the presentation
The link to the presentation at Affordable Comfort is: http://www.proctoreng.com/dnld/CentralValleyResearchHouses2014.pdf
One of my thoughts about all this is that the simple upgrades (many long known) are sufficient to provide massive reductions in heating and cooling use in US homes. Wall and Ceiling insulation, Attic air sealing, Minimized duct surface area (short runs with smaller ACs and furnaces) Buried ducts in dry climates, High CFM per ton in dry climates, High Sensible EER in dry climates, Good windows if you have really bad ones (after the items listed before)
The high temperature in
The high temperature in Stockton last Wednesday was 97 degrees F, Last Thursday the high was 99 degrees F.
Allison et al. One of my
Allison et al. One of my continuing frustrations is that with the global temperatures rising people keep looking at exotics rather than figuring our how we can get the vast majority of buildings to perform much better with simple known items. Another frustration is the notion of cost effectiveness that often results in us robbing from future generations. Not everyone has the disposable income to do a deep energy retrofit. What we need as a society (as a species) is to figure out how we can accomplish the energy efficiency upgrades for most of our buildings.
John – Hear, hear! What you
John – Hear, hear! What you are proposing is EXACTLY what I am trying to do here in Cleveland. Design solutions that are well beyond a simple prescriptive attic job, but a good bit short of a deep energy retrofit. $15-30K will do A LOT in most houses. With a 15 year term, that’s $100-200/mo to get a lot of comfort, too.
Thank you SO MUCH for doing what you are doing. We need to stop only doing the extremes of the spectrum – not much or going overboard, and do the middle stuff that people can afford.
Nate, I have felt the same
Nate, I have felt the same way about “the spectrum” for a long time, now. Typical of Americans we get all googley eyed over passive design, boutique extreme energy efficient dwellings, net zero, etc. but ignore the elephant in the room, which is the vast existing housing stock that with even modest levels of retrofit can perform much better than they currently do, in terms of both energy reduction and comfort.
Allison, thanks for posting this article. This is the kind of stuff I love hearing about, snd learning from. And great job with that teaser photo of the “reference system”…it set off quite a few “hack job” alarms! 🙂