Which Indoor Air Pollutants Matter Most?

That face above is of a physician, alchemist, and astrologer named Philippus Aureolus Theophrastus Bombastus von Hohenheim. He is deemed the father of toxicology and is better known by the name Paracelsus. I begin this article with him because Dr. Brett Singer, at Building Science Summer Camp this year, used an interesting Paracelsus quote:
“Poison is in everything, and no thing is without poison. The dosage makes it either a poison or a remedy.”
The pollutants in your indoor air
I wrote about Singer’s mention of the Corsi Code in August and his kitchen ventilation data last month, but his presentation covered more than those two things. He began with a look at some of the various indoor air pollutants and and which ones we ought to worry more about. Here’s his list of the biggies:
- Particulate matter
- Secondhand smoke from cigarettes (SHS)
- Nitrogen dioxide (NO2)
- Carbon monoxide (CO)
- Ozone (O3)
- Gas-phase organics (a.k.a., volatile organic compounds, or VOCs)
- Mold
- Allergens
- Bioeffluents (including carbon dioxide)
- Radon
- Viruses
Of course, if we wanted a full list of every individual pollutant, we’d have to expand this list quite a bit. VOCs, for example, include a wide range of different chemicals: formaldehyde, benzene, acrolein, and more. And, according to the Centers for Disease Control (CDC), “tobacco smoke contains more than 7,000 chemicals, including hundreds that are toxic and about 70 that can cause cancer.”
OK, so which of those should we worry about the most? Which should we focus our efforts on minimizing?
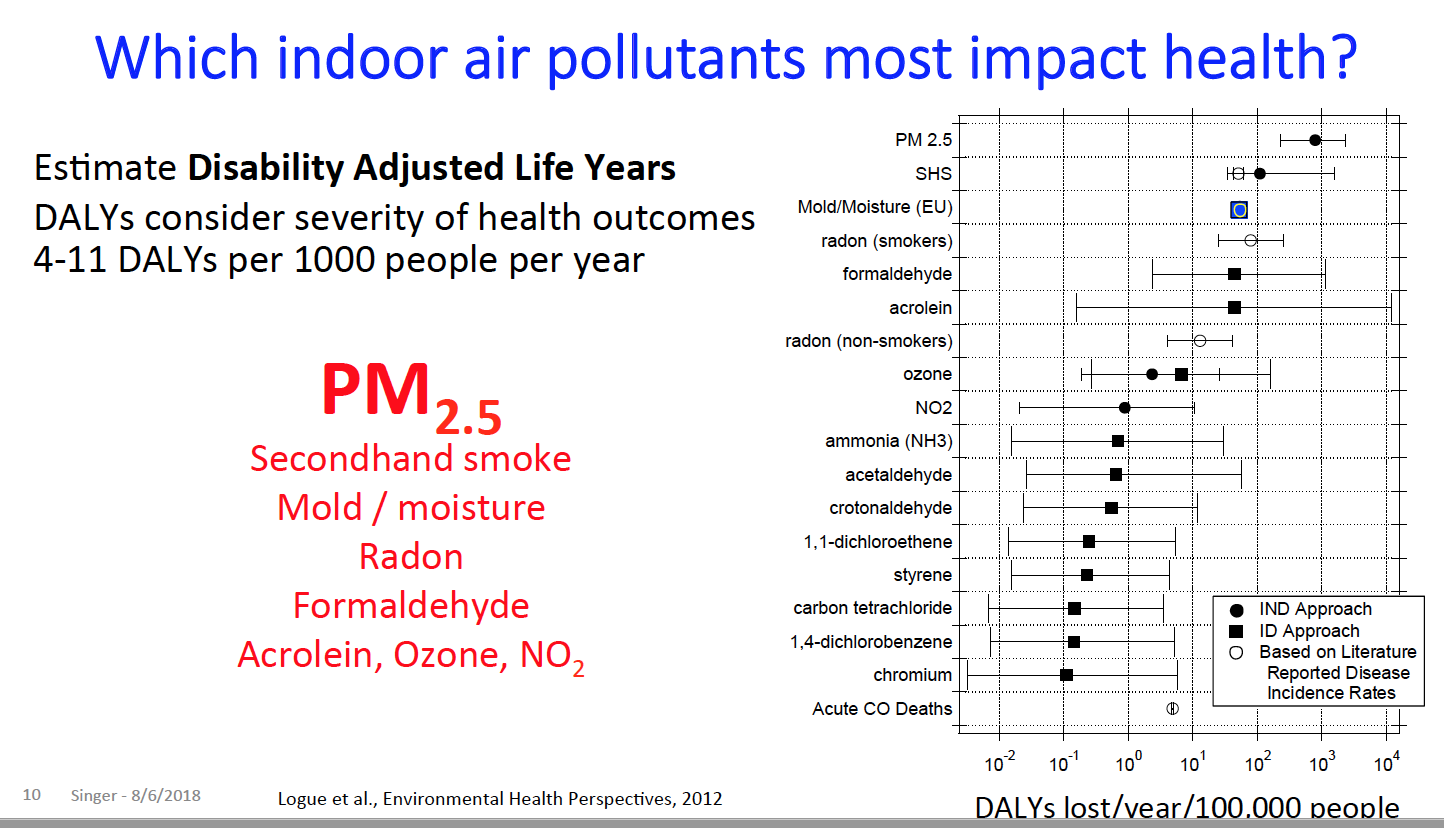
Singer had a slide for that. In terms of a quantity called Disability Adjusted Life Year (DALY), he presented a graph of the health impact per year per 100,000 people. Here it is.
What do these numbers mean?
Note that the scale of the graph changes by powers of ten. Near the bottom of the list, chromium is sitting at about 10-1, or 0.1. At the top is PM2.5 at about 103, or 1,000. Clearly then, PM2.5 deserves a lot more attention than chromium. In fact, it looks like it deserves more attention than pretty much anything else on the graph.
The rankings in this chart, though, are based on averages over the whole population included in the studies. You can’t look at that chart and say that every household will be affected the same way. PM2.5 may be at the top, but in a house where someone smokes indoors, secondhand smoke is most likely your biggest risk. Likewise with the other pollutants.
Another factor to consider is that not everyone reacts the same way to these pollutants. Most of the impact is felt by sensitive populations, like people with asthma, the elderly, or those with other existing health problems.
What you can do to improve your indoor air quality
Thinking about improving your indoor air quality in the abstract is all well and good, but it helps when you have a chart like the one above. Here’s my short list of recommendations:
1. PM2.5. First, always run your kitchen range hood and bath fans whenever you’re doing anything that might generate particulate matter. Second, filter the outdoor air you bring in through a mechanical ventilation system and filter the indoor air. (I’ve got some articles on filtering the air coming soon, so stay tuned.)
2. Secondhand smoke. Don’t allow smoking in the house. Simple, right?
3. Mold and moisture. Address any moisture problems in the house to make sure things stay dry and that they can dry out when they get wet. This is one of the biggest issues in building science because moisture causes a lot of problems.
4. Radon. Get a radon test. Get your home remediated for radon if the results show too high a radon level. Radon is the second-leading cause of lung cancer.
5. NO2. Don’t use unvented combustion appliances. Yeah, that nice-looking ventless gas log fireplace could be making you sick.
6. Carbon monoxide. Get a low-level CO monitor. I can’t say this often enough. The standard UL-rated CO detectors won’t give you an alert until the level is dangerously high, like 70 parts per million (ppm) for a couple of hours. But you could have 60 ppm for days on end with no idea that you’re being poisoned.
7. VOCs and other chemicals. Source control. As much as possible, pay attention to the materials you bring into the home. Don’t know enough? Go to the Six Classes website. Then use mechanical ventilation to dilute what you do get.
There’s nothing inherently difficult about changing an existing home to improve the indoor air quality or building a new home that will have good IAQ from the beginning. The devil, as always, is in the details.
Now that you know which indoor air pollutants might have the biggest impact on your health, you can craft a strategy to reduce their concentrations from the poison level to something more benign. I don’t recommend trying to turn PM2.5 or radon into a remedy, but, unlike Paracelsus, I’m not an alchemist.
Related Articles
The 2 Main Problems With Kitchen Ventilation
Will a Humidifier Hurt Your Indoor Air Quality?
4 Ways a Bad Duct System Can Lead to Poor Indoor Air Quality
Image of Paracelsus from the Wellcome Collection, used under a Creative Commons license.
NOTE: Comments are moderated. Your comment will not appear below until approved.
This Post Has 16 Comments
Comments are closed.
Perhaps 24/7/365
Perhaps 24/7/365 dehumidification should also be on the list? It seems like we’re fighting a lot of low sensible/high latent conditions this year.
Great short list of pollutants!
Does Ozone not help eliminate
Does Ozone not help eliminate other VOC’s? With a half life of 45 minutes at 72 degrees and required to be produced by sunlight or electrical arcing, aren’t indoor ozone levels lower than outdoor ozone levels?
I am still trying to figure
I am still trying to figure our “DALY’s”. If PM2.5 result in 1000 DALY’s, which seems to mean 1000 “lost years” per 100,000 people-years, that means about 1 lost year per 100 person-years, which means that, on average, if you should have lived to be 100, you would only live to 99 (one lost year) because of PM2.5? I am guessing that this chart is based on some average measured value of PM2.5. What is that value? How much would it have to be reduced to get that “lost year” back? I agree that the chart shows that PM2.5 is way worse than chromium, but I am wondering just how bad PM2.5 actually is?
Roy, I think you may be
Roy, I think you may be looking at this the wrong way. I’ll have to dig into the research behind the chart to know for sure, but I don’t think it’s going to be based on a certain PM2.5 level. One person might be affected by lower level than another. It’s the DALYs that matter, and I think that’s what tells you how bad PM2.5 really is.
The harder question is whether the numbers in the chart come from correlations or from causal relations. I’ll see what I can find.
Such research basically shows
Such research basically shows the average impact of exposure to different pollutants. Different individuals experience vastly different exposure depending on their circumstances. A given pollutant can have a certain level of impact on an individual, within different communities, and globally. Depending on whether you are looking at the global impact, impact within a specific community or cohort of people, the average impact most often differs from the global impact of that pollutant. PM2.5 leads to premature deaths and drives more disease very unequally around the world and even within small communities depending on the exposure of each individual and the health status and vulnerability of each individual. This article addresses the problem of indoor air pollution and is aimed at individuals making decisions regarding remediation of their exposure to indoor air pollutants. PM2.5 is a very important air pollutant globally, but for certain individuals, it may be radon, or VOCs, etc. You need to assess your specific indoor air quality situation and determine if exposure to PM2.5 indoors is an issue for your home. If wildfires are common around where you live, or you live close to a motorway, for example, PM2.5 is likely going to be an important indoor air pollutant for you to focus on.
Building science has a
Building science has a systems view that absolutely applies here. There is a rich, dynamic, interwoven, unpredictable indoor chemistry occurring as each of these pollutants interact w/ the others, plus the enclosure and the people. So glad that you’re getting this info out there Allison!
Some missing BIGGIES might
Some missing BIGGIES might include – Bacteria, Mycotoxins, Endotoxins, Inflammagens, Actinomycetes, Beta Glucans and Microbial VOC’s.
I hope your filtration
I hope your filtration articles will address improper installation. I routinely see restrictive air filtration systems (no transitions, too small surface area, improperly sealed) that cause more problems than they potentially solve.
Dan, yes, my next article
Dan, yes, my next article will be all about the problems leading to poor filtration, like bypass.
[[{“fid”:”217″,”view_mode”:”default”,”fields”:{“format”:”default”,”field_file_image_alt_text[und][0][value]”:”HVAC filter, falling down”,”field_file_image_title_text[und][0][value]”:”HVAC filter, falling down”},”link_text”:null,”type”:”media”,”field_deltas”:{“1”:{“format”:”default”,”field_file_image_alt_text[und][0][value]”:”HVAC filter, falling down”,”field_file_image_title_text[und][0][value]”:”HVAC filter, falling down”}},”attributes”:{“alt”:”HVAC filter, falling down”,”title”:”HVAC filter, falling down”,”class”:”media-element file-default”,”data-delta”:”1″}}]]
Air bypassing filters is a
Air bypassing filters is a major issue that occurs with relatively small leaks/bypass that causes major issues in time.
This is great stuff. I’ve
This is great stuff. I’ve been hoping to find better research around indoor air quality in homes, in particular, any data that quantifies risk from a health standpoint. My personal opinion is that the industry jumped all over energy efficiency because it’s measurable and can be weighed against costs, payback, associated carbon, etc. I’ve been saying water efficiency might be the next big thing because it’s also more easily measured than health. Although market research shows that people pay a lot of money, time, etc towards healthy lifestyles it’s always been so hard to quantify.
This article from Sept 2016
This article from Sept 2016 ASHRAE Journal is particularly relevant to risk assessment and remediation of PM2.5. In particular, it looks at the correlation between filter MERV ratings and PM2.5, which is not specifically tested for MERV.
https://bit.ly/2PPh6PI
Thanks, David. I guess I
Thanks, David. I guess I missed that article when it came out a couple of years ago.
Though I do not want to
Though I do not want to dispute the overall premise of the article, I do have one comment to add about Radon and the supposed Mortality/health risk associated with it.
The lung cancer number/risk associated with it really is a purely extrapolated guess based on a Hypothesis of LNT (Linear No-Threshold) which still is controversial and not proven.
https://www.ncbi.nlm.nih.gov/pmc/articles/PMC3834742/
https://www.ncbi.nlm.nih.gov/pmc/articles/PMC2663584/
I do not know if I would go with a hormesis effect (hypothesis) but you could make an argument that it is just as valid and should be tested.
These risk asssements is all based on very conservative assessment of ionizing radiation that still has not been proven.
That said, a guess of a million lung cancer cases due to low-level radon radiation is as accurate as a guess that low-level radiation may have health benefits and has saved lives.
Please give some examples of
Please give some examples of PM2 and their common sources
Sources of PM2.5 include:
Sources of PM2.5 include:
1) exhaust of vehicles and small internal-combustion-engine-powered appliances, such as lawn mowers, snow and leaf blowers, etc.; infiltration of outdoor air indoors brings PM2.5 particles originating from exhaust, industry, tire and brake wear and tear, other combustion sources, and from various natural sources (wildfires, vegetation, dust, volcanic activity, etc.) into indoor spaces;
2) any indoor burning (candles, smoking, incense);
3) consumer products that are sprayed (sunscreen, deodorant, etc.);
4) cooking.
This is an incomplete list.