Big News: The R-Value of Insulation Is Not a Constant
In the world of building construction, improvement, and analysis, we talk about R-value all the time. Generally we talk about it as if it’s a constant number. Hey, R-19 is stamped right there on the product, so that’s what it is, right? Well, maybe. Sometimes.
Home energy raters and others who have learned a little building science along the way know that how well it’s installed can affect the performance of insulation. RESNET has developed guidelines for grading the quality of installation, and home energy rating software derates the performance for insulation not installed to Grade I quality.
But what about temperature? Does a given piece of insulation have the same R-value as you change the temperatures across it? Why, no. No, it doesn’t, as it turns out. And for one popular type of insulation, the results may change the way you insulate buildings. Keep reading.
How is R-value measured?
Because of scams involving R-value claims that didn’t match reality, the US Federal Trade Commission (FTC) devised the R-value Rule to protect buyers of insulating products. In fact, just this year the FTC handed down its largest fine ever ($350,000) to a company claiming that its paint had an R-value of 100.
So, the R-value Rule requires testing insulation using one of 4 American Society of Test Methods (ASTM) standards. The basic requirement is that the mean temperature must be 75° F (24° C) with a temperature difference of 50° F (28° C) across the insulation. According to Building Science Corporation, most R-value testing is done with a temperature of 50° F (10° C) on the cold side and 100° F (38° C) on the hot side.
Is this realistic?
If you’re putting insulation in a building where we humans are going to hang out, how often do you think either of those temperatures will be on the inside of the building? Hmmm. If it’s 100° F outside, I can’t imagine ever getting the house down to 50° F, nor could a standard air conditioner get a house that cold. If it’s 50° F outside, I’m sure not going to run the thermostat up to 100° F. I’m already burning up at 78° F, the temperature my 91 year old father-in-law likes to keep his house.
No, temperatures of 50 and 100° F across the insulation don’t represent realistic conditions. The indoor temperatures we use in heating & cooling load calculations are 70° F for winter and 75° F for summer. This may be one of the unrealistic test methods Joe Lstiburek was thinking of when he said at Summer Camp last year that ASTM stands for Another Stupid Test Method.
Many insulation types improve as it gets colder outside
At Building Science Summer Camp in 2011, Chris Schumacher gave a talk on Building Science Corporation’s Thermal Metric Project. They’ve built what’s probably the world’s most sophisticated apparatus for measuring R-value, called a hot box. I got a chance to visit their lab in Waterloo, Ontario a couple of months ago and will write more about that later.
In his Summer Camp talk (pdf), Chris showed the following three slides.
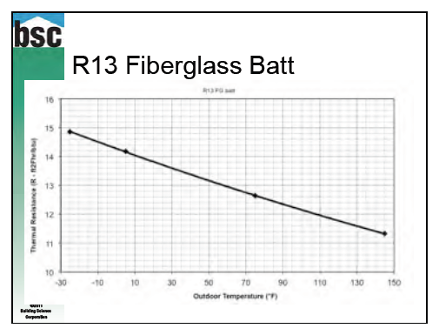
Fiberglass batt insulation gets better with colder outdoor temperatures. An R-13 batt actually hits its nominal R-value at an outdoor temperature of about 60° F.
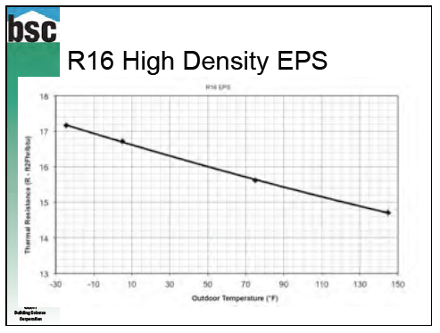
Expanded polystyrene (EPS) is the white foam you see in disposable coffee cups and beer coolers. Its nominal R-value is 4 per inch. It’s the main type of rigid foam board used in structural insulated panels and is also used as roof and wall sheathing sometimes. Like fiberglass, it also gets better with colder temperatures.
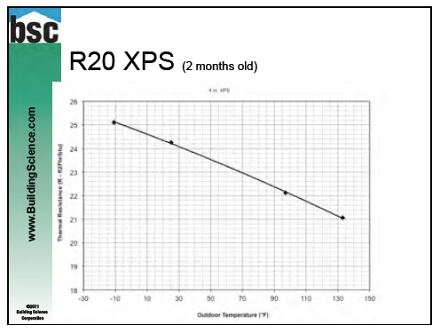
Extruded polystyrene (XPS) likewise improves with colder temperatures. Its nominal R-value is 5 per inch. This is the foam you see used a lot for exterior wall sheathing. It’s generally blue (Dow) or pink (Owens-Corning).
One of these is not like the other
A third type of foam board is polyisocyanurate, often called just polyiso. Its nominal R-value is 6 per inch. It’s a popular product for roof and wall sheathing because of its higher R-value per inch but…
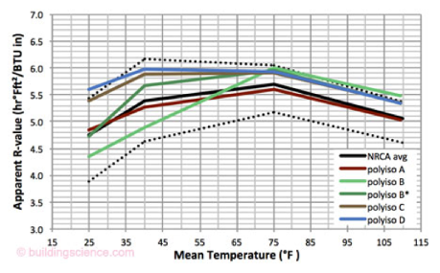
Polyiso gets worse when it’s cold outside. Building Science Corp. has been doing research on this for a while, and they just published their polyiso results a week and a half ago. They looked at products from several manufacturers, and you can see the results below. Polyiso, it turns out, can lose as much as 25% of its R-value when the temperature drops.
Why does this happen? The hypothesis is that the gas in the closed cells of this foam condenses at relatively high temperatures. In footnote 10 of the BSC paper, they write, “if the walls of the cells are coated in a highly conductive condensate (a liquid), heat transfer will increase and the R-value will go down.” Honeywell wrote a paper about the potential for condensation (pdf) a few years ago as well.
What does this mean for polyiso?
The takeaway from the polyiso results is that you’re not getting as much R-value as you think you’re getting when the temperature drops. This is more an issue for cold climates, so you Floridians and Texans don’t need to worry about this at all. Minnesotans, however, might want to adjust their designs a bit if they’re using polyiso.
Even in cold climates, though, keep in mind how this really applies. I was talking with Joe Lstiburek about this last month, and, as he’s so good at doing, he pointed out what should have been obvious to me from the start. If condensation in the foam is the cause, it’s only going to happen in the parts of the foam that are below the gas’s dew point, that is, the outer layers.
Some things you can do to mitigate the R-value diminution are:
- Use more polyiso.
- Cover the polyiso with another type of insulation that will keep it warmer.
- Don’t insulate the cavities. Use enough exterior insulation to meet your requirements. (Think Perfect Wall.)
Regarding that last point, if you put cavity insulation between the polyiso and the indoors, the polyiso will stay colder. Putting just a thin sheathing of polyiso over insulated cavities will give you the worst performance you can get with polyiso in cold weather. It won’t necessarily be bad. It’s just not going to be the R-6 per inch you think you’re getting.
The lowdown on R-value
The main point here is that R-value isn’t some constant number for a given material, and installation isn’t the only factor that affects it. As you can see above, temperature has a significant effect as well.
Although I said in the title that this is big news, the temperature dependence of R-value isn’t really news in the world of building science at all. Well, the polyiso results are relatively new, but the rest of it’s not. To many who work with insulation every day, however, the idea of a variable R-value could be as Earth-shaking as the Turbo-Thermo-Encabulator Max has been to the HVAC industry. Maybe even moreso.
Like this article? Subscribe to our blog, which is ‘off the chain,’ according to home builder Chris Senior.
Related Articles
How to Grade the Installation Quality of Insulation
Combobulating the Perfect Wall – The Basics of Control Layers
This Post Has 17 Comments
Comments are closed.
Thanks for including the
Thanks for including the graphs. This concept is much better asimilated when a picture presents the relative changes.
I am assuming the degradation is further compounded by poor installation and bypasses?
I don’t have a Man J handy. Are these effects accounted for in the manual, or software applications? My recollection is that they are not.
Geoff: The
Geoff: The results I discussed here shown only the temperature dependence but R-value can also vary with air moving through, the amount of moisture it holds, installation quality, and thermal bridging when we’re talking about assemblies. No, Manual J doesn’t account for the temperature dependence of R-value. To do so, you’d have to enter the type of insulation installed, and no load calculation software that I know of does that.
What about other forms of
What about other forms of insulation, Cellulose, Rockwood, spray foams. Are we on one own to extrapolate (assume) from fibrous testing to all fibrous, and from factory formed rigid to onsite applied rigid?
Great article put you should
Great article put you should also think about this in hotter conditions.I have seen fiber glass tested at high numbers, example a hot attic and the R-value goes in the downward direction.
First, thanks are due to BSC
First, thanks are due to BSC for publishing this. A lot of us have been aware of the concept that insulation performance could vary with temperature, but didn’t have the solid science to back it up.
I believe all the values given above are taken without any infiltration effect, which could alter the results for the fibrous material. I would be hesitant to extrapolate from one fibrous material to another. I think when further testing is done a clearer picture will emerge on the “fluffies”.
Probably the most important point is to read Allison’s previous post and understand what the conditions are where the building is.
I’m sure this will cause some gnashing of teeth as we learn more about the performance of insulation and have to deal with it’s variable performance. But in the end it should improve the work we do as designers and specifiers of wall systems. The spreadsheets are going to be a bit more complex now 😉
Thanks Allison, this is an
Thanks Allison, this is an excellent overview of this often confusing issue.
When you talked to Dr Joe did he indicate an ideal amount of EPS or XPS to apply as the outermost layer in a Polyiso sheathed wall to over come the Polyiso’s short coming in cold climates?
Perhaps you could share your thoughts on the ideal thickness. I’m thinking about the ‘perfect wall’ for my own home as a retrofit and have been planning to use 6″ of Polyiso. Now maybe I would switch to 4″ of polyiso and 2″ of EPS or XPS. I suppose any amount would help, but what do you suggest?
Great article. I’d like to
Great article. I’d like to see a chart of all insulation products across a temp scale of 0-100 F. I’d like to see a similar graph of performance with air and/or moisture introduced. Another topic to consider: R value per inch values as you increase the thickness. (the law of diminishing returns).
John N.:
John N.: Good question. I haven’t found data yet on other types of insulation but I’ll let you know if I do.
Peter M.: Yes, when air can move through the insulation, that can change the performance significantly. Oak Ridge showed this for blown fiberglass in attics in the early ’90s. What I’m reporting on here is what happens only because of changing temperature.
Bill S.: Yes, indeed. BSC is doing a lot of great work and making their info available to everyone.
Mark F.: No, we didn’t talk about that, but you can look at the charts in their report and see how much the R-value diminishes. The ideal thickness of insulation is subjective and is a choice for the parties involved in building the house (once you’ve met code, that is). Some people use the 20-40-60 rule for cold climates: R-20 floors, R-40 walls, and R-60 ceilings. In warmer climates, you don’t need that much.
Ryan S.: You’re going to get your wish…eventually. One of the things that makes BSC’s hot box so special is that they can carefully control the introduction of air and moisture and study the effects. So, wait a bit, and they’ll be putting those results out, too.
John N: High density (11.0
John N: High density (11.0 pcf) rock wool boards do increase slightly in R-Value at lower temperatures. Something like R-3.9 per inch at 75 deg F mean temp to R-4.2 F per inch at 40 deg F mean temp. I think those values have been confirmed by BSC.
Allison,
Allison,
Good blog — but as you admitted toward the end, not really news.
Two years ago (http://www.greenbuildingadvisor.com/blogs/dept/musings/bold-attempt-slay-r-value), I wrote, “Building scientists have known for years that the rate of heat flow through insulation materials varies at different temperatures. … Polyiso doesn’t perform as well at low temperatures. That’s because the trapped blowing-agent gases start to condense at cold temperatures.”
Allison,
Allison,
I was waiting for you to mention moisture and you did in the comments. I was surprised that the graphs, especially for fiberglass, did not account for RH.
@Allsion, it’s important to
@Allsion, it’s important to note that the polyiso graph you reproduced does not account for aging. Also, that graph is based on 2″ samples. If the assumed mechanism at play is correct, then a 1″ layer would show greater relative degradation, no?
@Mark, it is easy to estimate the amount of XPS needed to keep polyiso above it’s peak zone (35F). Just sketch out a temperature gradient across the wall section (don’t forget to include inside and outside air films). But if we take the above graphs as face value, why not just use 6″ of XPS?
I am curious about sips with
I am curious about sips with a polyurethane core. There seems to be some chemical relationship between polyiso and polyurethane so does the r value of polyurethane in sips go up or down as the temperature decreases.
I think for me Eps is the
I think for me Eps is the best choice, is R value is at 100% and will not decrease on time. QUESTION:WE INSULAT A BUILDING FOR A SHORT PERIODE OF TIME ?? AND WE ACCEPT SOME INSULATION THAT WILL DECREASE ON TIME WHY ??
@Christian, there are often
@Christian, there are often reasons other than R-value that dictate one type insulation over another. For example, polyiso is often used in crawl spaces because it comes with aluminum facing. Code prohibits exposed EPS or XPS in that application. Sometimes there are structural reasons for using XPS over EPS.
Most importantly, the normalized price per unit of R-value for a given product may still be lower after accounting for the degradation.
For all of those reasons, I would never assume one type of insulation is always the best choice.
Why was the XPS tested at R
Why was the XPS tested at R-20 and the Polyiso tested at R-6? This seems like bad science. Though it may be true that Polyiso loses effectiveness at low temp, it has also been shown that the rate of loss decreases with thickness – so the XPS was given an advantage. Apples to oranges and bad science. I like XPS, but for serious comparison you have to test the products in the same way (including same or similar thicknesses.)
Shipley:
Shipley: That’s a good question, and I should have addressed that in the article. If you click over to the original article, you’ll find that that they actually did compare oranges to oranges. The graph above shows the R-value per inch. They tested polyiso at 2″ and 4″ thicknesses. The interesting part of this research wasn’t what the actual R-value for polyiso is. It’s that the R-value takes a big dip when the temperature drops.