Psychrometrics – Impenetrable Chart or Path to Understanding?
I have a confession to make: I’ve fallen in love with psychrometrics! After water itself, moist air has got to be the most interesting substance in building science. And the psychrometric chart, in all its many manifestations and with its multitudinous quantities, is a thing of beauty. Well, at least it is to me, and maybe it will be to you, too, after you get to know it a bit better.
What is psychrometrics?
One of the problems with learning this subject is that a lot of people jump straight into the chart without understanding exactly what psychrometrics is. Unless you’re an engineer, physicist, or meteorologist, your first encounter with the field of psychrometrics may have been the psych chart itself, with a little explanation of how it relates dry bulb temperature, relative humidity, dew point temperature, and “absolute humidity.” (I put that last term in quotes for a reason. You’ll find out why in part 2 of this series.)
My purpose here is to define the basic terms and put the field of psychrometrics in its proper context for you. The bible of psychrometrics, on which I’m basing a lot of what I’m telling you here, is the book, Understanding Psychrometrics by Don Gatley. Here’s his definition of psychrometrics:
Psychrometrics – the science that involves the properties of moist air and the processes in which the temperature or the water vapor content or both are changed
Today I’m going to stick to covering the absolute fundamentals and save the explanations of the various psychrometric quantities and processes for a future article.
The 2 components of moist air
So, that term, “properties of moist air” is our focus, and it’s a term loaded with meaning and implications. Again, though, we need a definition before we can advance. What is moist air?
Moist air – a mixture of dry air and water vapor; also known simply as “air”
Now, if we can just get a handle on those two things, we’ll be ready to begin.
First, we know that moist air is a mixture. It’s not a pure substance. The two components, dry air and water vapor, have different properties, with one thing in particular making this mixture of supreme importance in meteorology, air conditioning, and other areas. (Do you know what it is?)
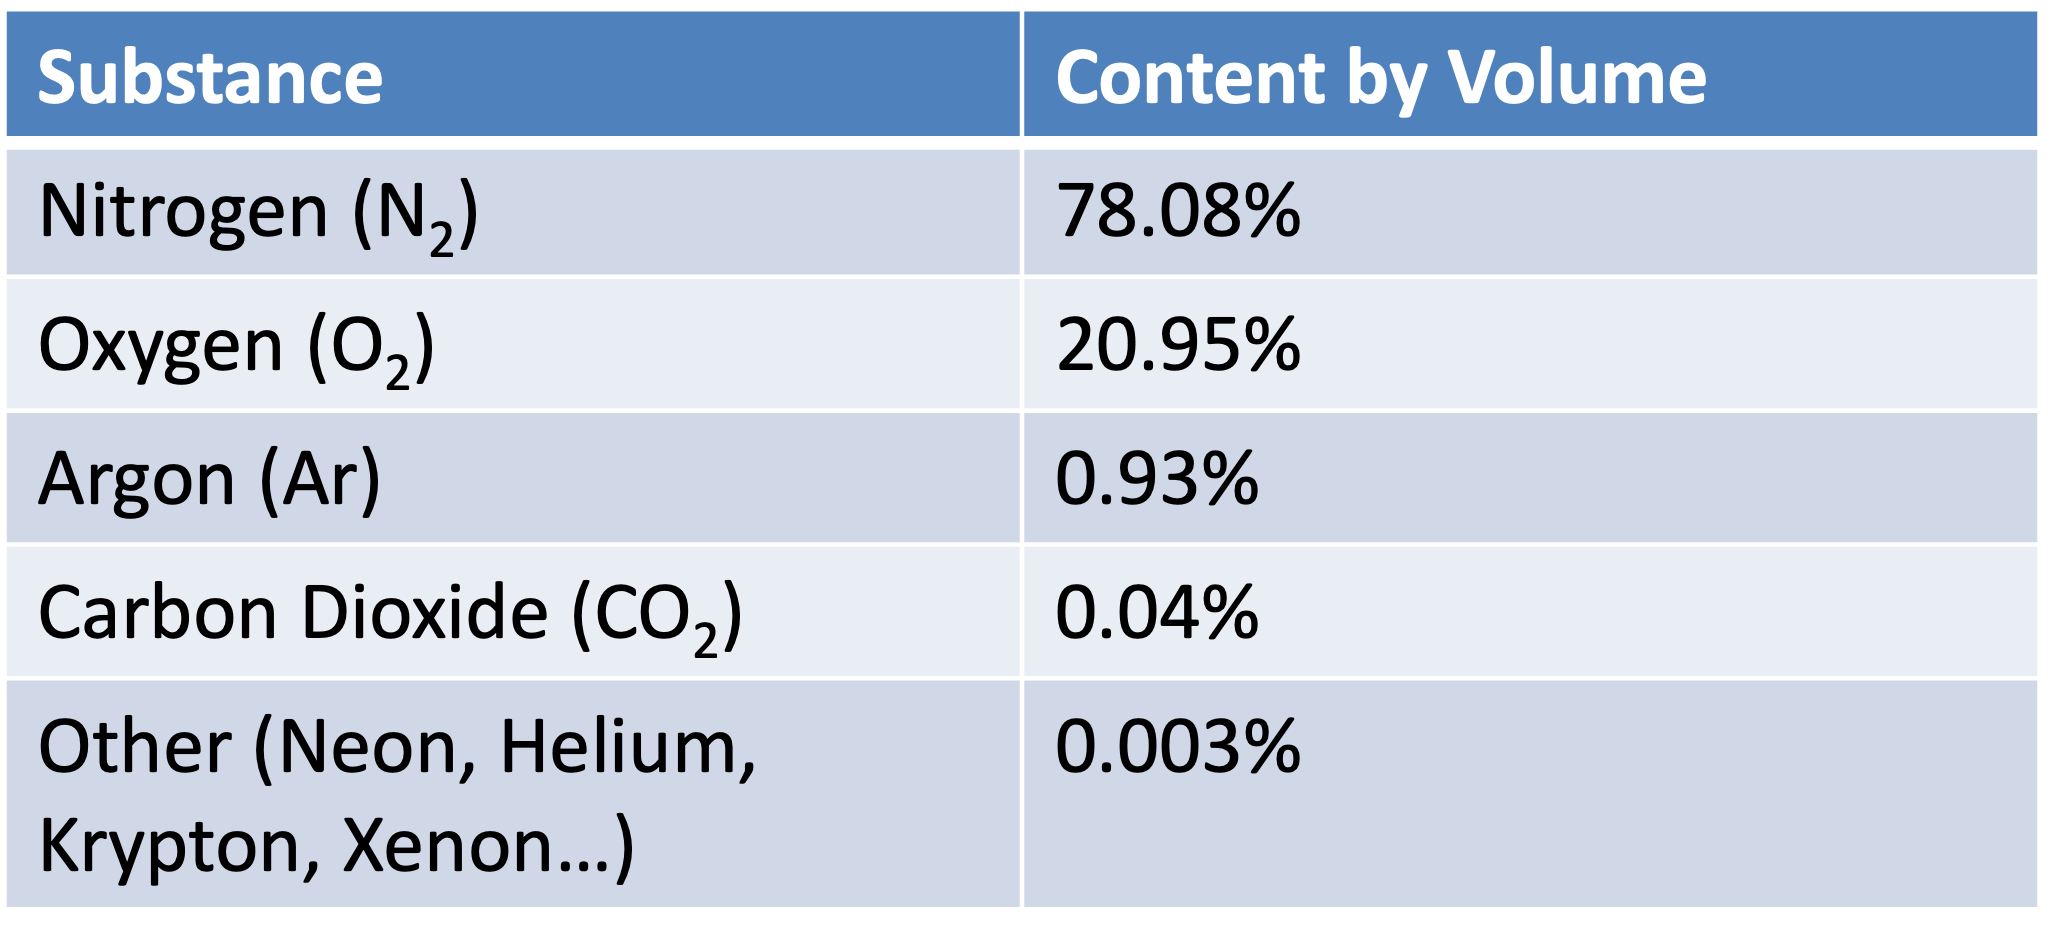
Let’s take a look at the two components now. Dry air itself is also a mixture. The table below shows the major components and a few minor ones, too.
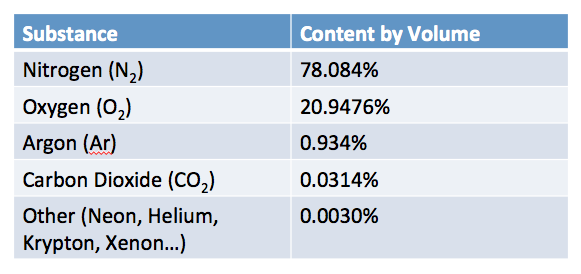
Each of those elements and compounds has its own set of properties but there’s one important thing they have in common. It’s also the thing that distinguishes dry air from water vapor. Here it is:
The dry air components don’t change phase at the normal temperature and pressure ranges we deal with.
As long as the temperature is above about -100° C (-148° F), all of the dry air components exist in the gas phase only. They don’t condense out of or evaporate into the air.
But that’s exactly what water vapor does. When the temperature drops at night, we wake up in the morning to find dew on the grass and on our cars. (Although you dry climate folks might have difficulty believing, that photo above is dew I found on the top of my car one summer morning.) When the sun hits the grass later in the morning, the dew starts evaporating and will have all returned to the air after a while.
The magic of water
Water has so many amazing properties. I recently wrote about the physics of water in porous materials and there I discussed all four phases of water. In the field of psychrometrics, however, our primary focus is on water vapor.
 So water can go in and out of the vapor phase, thereby changing the properties of this stuff we call moist air. Air that has a very low content of water vapor might have only a few tenths of a percent of water vapor by mass. The most humid air that occurs naturally has about 3 to 3.5% water vapor by mass. That’s equivalent to an ungodly dew point of about 95° F, but we’re getting ahead of ourselves a bit.
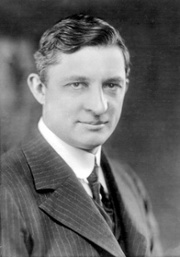
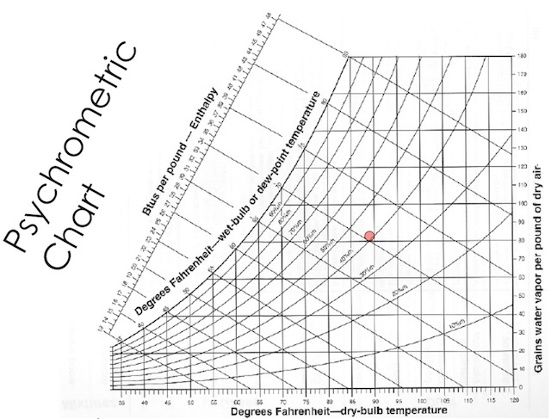
The point of psychrometrics is to understand what’s happening with the water vapor component since it’s the part of moist air that can undergo so many changes. As it turns out, a fellow by the name of Willis Carrier developed a tool that became enormously useful in the 20th century: the psychrometric chart. It allows us to locate the state point for a particular volume of air and then plot the changes it goes through as the conditions change.
From chemistry to psychrometrics
So where does the psychrometric chart come from? Let’s begin with the pressure-temperature diagram for water, shown below. In psychrometrics, we care mainly about the yellow region and what happens at the boundary between the vapor phase and the liquid or solid phases.
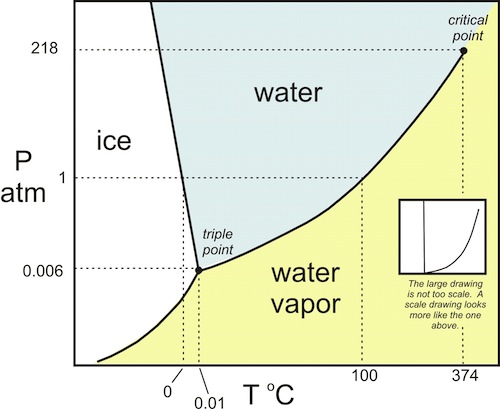
That boundary in the pressure-temperature diagram is the same boundary you see in the psychrometric chart. It’s the 100% relative humidity curve, also known as the saturation curve.
In the yellow region, water vapor behaves pretty much like an ideal gas, so that and the pressure-temperature diagram take us back to our introductory chemistry class. The application to psychrometrics, as you might expect, is a bit more complex, but we won’t go deeply into the math in this series.
Now you’ve got the foundation for understanding the subject of psychrometrics. We’ve got the very basic definitions out of the way. Next up, we’ll take a look at the multifarious psychrometric quantities available and their definitions. (I’ve mentioned a few of those quantities already, but there are more…many more.) Then we’ll divide them into two groups: those that are

measurable and those that must be calculated (plus a bonus dichotomy of those that are preferred and those that are discouraged). Following that, we’ll be ready to dive into some of the really fun stuff you can do with psychrometrics, like:
- Look at what happens when air passes through an air conditioner
- Find the result of mixing ventilation air with house air
- Figure out what we need to do to access “forbidden” regions of the chart
Once you’ve mastered all that, you, too, can sport a psych chart T-shirt, as Henry Gifford is doing in the photo at right.
Allison A. Bailes III, PhD is a speaker, writer, building science consultant, and the founder of Energy Vanguard in Decatur, Georgia. He has a doctorate in physics and is the author of a bestselling book on building science. He also writes the Energy Vanguard Blog. For more updates, you can subscribe to our newsletter and follow him on LinkedIn.
Other Articles in the Psychrometrics Series
Psychrometrics, Part 2 – The Quantities in the Chart
Fundamentals of Psychrometrics, Part 3
External Resource
Psychrometric Chart Celebrates 100th Anniversary by Don Gatley (pdf)
Related Articles
Dew Point — A More Meaningful Measure of Humidity?
Vented Crawl Spaces and the Psychrometric Chart Are Not Friends
Are You Making This Mistake with Humidity?
Vapor Retarder? Vapor Barrier? Perms? What the Heck?!
The Wicked Witch of the West, Phase Changes, and Building Science
NOTE: Comments are closed.
This Post Has 16 Comments
Comments are closed.
Hmmm. The chart form is
Hmmm. The chart form is intimidating. When it is shrunk down to fit a screen, some info is unreadable and that reinforces a person’s tendency to think this all is incomprehensible. <br /> <br />Psychrometric calculators — would like if you would write a bit about them. I have found them to be far more useful than the charts for my purposes, but maybe I am not seeing the whole picture. <br /> <br />If I had to teach only one of the topics, it would be absolute humidity, the various ways to express it, and how that relates to relative humidity in our houses. <br /> <br />Thanks for writing.
Allison, <br /
Allison, <br /> <br />Yet another excellent primer! <br /> <br />To his credit, our weather guy on Channel 2 , Reno has added dew point to his visuals and has made time to explain why it matters and why RH, not so much. <br /> <br />May I anticipate discussion of sublimation? <br /> <br />Always wondered how that occurs with no energy added…or is it? <br /> <br />Also, based on the definition of moist air, does purely "dry" air even exist in nature? Or is that why it’s just called "air"? <br /> <br />All the best.
Keep in mind that Willis
Keep in mind that Willis Carrier developed the psychrometric chart using a slide rule among other archaic (by today’s standards) tools. <br />I used to drive by his estate every day going to work. <br /> <br />His VP and senior researcher, Carlyle Ashley, invented the Weathermaker in 1930, a gas furnace combined with an A/C unit. The psychrometric chart played a key role in its successful operation. <br /> <br />Carlyle, Dick Kornbluth, Larry Kinney, and myself tested the leakiness of a nearby nuke plant’s airlock doors in ’87. Carlyle was an engineer’s engineer and knew more about the psychrometric chart and its fringe applications than perhaps Willis Carrier. <br /> <br />The next time you grab a tall glass of iced tea and contemplate the condensation on the glass, remember that among his many patents, Carlyle also patented the ice cube (US2134544 A). <br />
Your article above is a great
Your article above is a great introduction to an absolutely essential topic for understanding HVAC design and function. Understanding psychrometrics (my mental state as well as the book you mentioned, of which I own a copy) has opened more doors for me than I thought when I first began grappling with a psych chart several years ago. Critical environmental control, building envelope performance, and meteorology are a few of these doors pried open by psychrometrics, among others. There’s even a psychrometric chart for the atmosphere we live in and breath, called a skew-t/log p, a graph I show to my HVAC students when they are tempted to complain how difficult the regular chart might be. <br /> <br />You make a great point that so often this subject is taught by first throwing the student to the big bad wolf of the psychrometric chart, without a prior introduction to basic psychrometric principles, such as evaporation, condensation, latent heat of vaporization and fusion. The more I teach this subject, the more parallels I see between it and refrigeration theory, which also involves vaporization and condensation, and has its own chart known as a Mollier diagram, which I’ve also heard psychrometric charts referred to as. <br /> <br />I don’t know if you’ve ever heard of the Refrigeration Service Engineers Society (RSES) but I am a member, and able to access great information written by fellow members on many HVAC/R subjects. One of the best treatments of psychrometrics apart from the "Understanding Pyschrometrics" book is an RSES SAM article written by Skip Krepcick titled "Practical Applications of Psychrometrics". I can send you a copy if you’re interested. He taught an eight hour CEU class on this subject at our annual RSES regional conference this past spring and I was in hog heaven. Really increased my understanding and will change how I teach it to my students for the upcoming fall semester.
Hmmm. The chart form is
Hmmm. The chart form is intimidating. When it is shrunk down to fit a screen, some info is unreadable and that reinforces a person’s tendency to think this all is incomprehensible.
Psychrometric calculators — would like if you would write a bit about them. I have found them to be far more useful than the charts for my purposes, but maybe I am not seeing the whole picture.
If I had to teach only one of the topics, it would be absolute humidity, the various ways to express it, and how that relates to relative humidity in our houses.
Thanks for writing.
Allison,
Allison,
Yet another excellent primer!
To his credit, our weather guy on Channel 2 , Reno has added dew point to his visuals and has made time to explain why it matters and why RH, not so much.
May I anticipate discussion of sublimation?
Always wondered how that occurs with no energy added…or is it?
Also, based on the definition of moist air, does purely “dry” air even exist in nature? Or is that why it’s just called “air”?
All the best.
Keep in mind that Willis
Keep in mind that Willis Carrier developed the psychrometric chart using a slide rule among other archaic (by today’s standards) tools.
I used to drive by his estate every day going to work.
His VP and senior researcher, Carlyle Ashley, invented the Weathermaker in 1930, a gas furnace combined with an A/C unit. The psychrometric chart played a key role in its successful operation.
Carlyle, Dick Kornbluth, Larry Kinney, and myself tested the leakiness of a nearby nuke plant’s airlock doors in ’87. Carlyle was an engineer’s engineer and knew more about the psychrometric chart and its fringe applications than perhaps Willis Carrier.
The next time you grab a tall glass of iced tea and contemplate the condensation on the glass, remember that among his many patents, Carlyle also patented the ice cube (US2134544 A).
Your article above is a great
Your article above is a great introduction to an absolutely essential topic for understanding HVAC design and function. Understanding psychrometrics (my mental state as well as the book you mentioned, of which I own a copy) has opened more doors for me than I thought when I first began grappling with a psych chart several years ago. Critical environmental control, building envelope performance, and meteorology are a few of these doors pried open by psychrometrics, among others. There’s even a psychrometric chart for the atmosphere we live in and breath, called a skew-t/log p, a graph I show to my HVAC students when they are tempted to complain how difficult the regular chart might be.
You make a great point that so often this subject is taught by first throwing the student to the big bad wolf of the psychrometric chart, without a prior introduction to basic psychrometric principles, such as evaporation, condensation, latent heat of vaporization and fusion. The more I teach this subject, the more parallels I see between it and refrigeration theory, which also involves vaporization and condensation, and has its own chart known as a Mollier diagram, which I’ve also heard psychrometric charts referred to as.
I don’t know if you’ve ever heard of the Refrigeration Service Engineers Society (RSES) but I am a member, and able to access great information written by fellow members on many HVAC/R subjects. One of the best treatments of psychrometrics apart from the “Understanding Pyschrometrics” book is an RSES SAM article written by Skip Krepcick titled “Practical Applications of Psychrometrics”. I can send you a copy if you’re interested. He taught an eight hour CEU class on this subject at our annual RSES regional conference this past spring and I was in hog heaven. Really increased my understanding and will change how I teach it to my students for the upcoming fall semester.
Nice article Allison. But to
Nice article Allison. But to be pedantic, psychrometrics is actually the study of gas-vapour mixes; water vapour just being the most common. <br /> <br />
<br />we don
<br />we don’t even teach psychrometrics anymore. <br /> <br />now we just show the kids the URL: <br /> <br />http://www.dpcalc.org/
Nice article Allison. But to
Nice article Allison. But to be pedantic, psychrometrics is actually the study of gas-vapour mixes; water vapour just being the most common.
we don
we don’t even teach psychrometrics anymore.
now we just show the kids the URL:
http://www.dpcalc.org/
I find this bold statement to
I find this bold statement to not only be false but offensive because psychometric charts are being taught in trade schools. If you are an instructor and can say that well then maybe you are the problem with your school not teaching this important science if you are the student well you can talk to the faculty above the teachers and remedy this major issue
If you really would like to
If you really would like to make a contribution to building air tight homes that don’t suck outside water(humidity in), why not address the lowly clothes dryer? Thank you in advance for your reply. ps the condensing dryers cost too much
If you really would like to
If you really would like to make a contribution to building air tight homes that don’t suck outside water(humidity in), why not address the lowly clothes dryer? Thank you in advance for your reply. ps the condensing dryers cost too much
I find this bold statement to
I find this bold statement to not only be false but offensive because psychometric charts are being taught in trade schools. If you are an instructor and can say that well then maybe you are the problem with your school not teaching this important science if you are the student well you can talk to the faculty above the teachers and remedy this major issue