2 Decades of Danny’s Home Energy Data
Danny Orlando, a manager in the ENERGY STAR program at the US EPA, walks the talk. He’s been steadily improving the energy efficiency of his home over the past couple of decades and also monitoring his energy use data. The graph above tells the story.
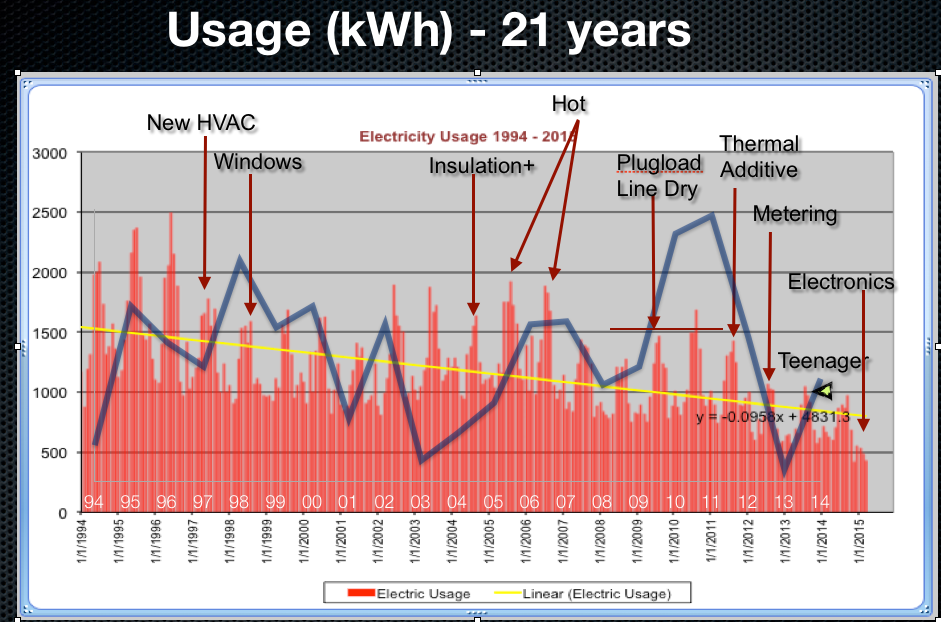
The heart of the chart are the data showing his electricity consumption, the red columns. From 1994 to 2015, he recorded the kilowatt-hours (kWh) he got billed for each month and created the graph. Then he showed when energy-saving (or using, in the case of the teenager) events occurred — new HVAC, windows, insulation… He also had the spreadsheet fit the data to a line (the yellow one), which makes it easier to see the reduction in his electricity consumption over the 21 years shown here.
Nice! He used almost 1700 kWh per month in 1995. His average for 2015 so far is about 570 kWh per month. So even with the teenager showing up, he has cut his bills to a third of what it had been!
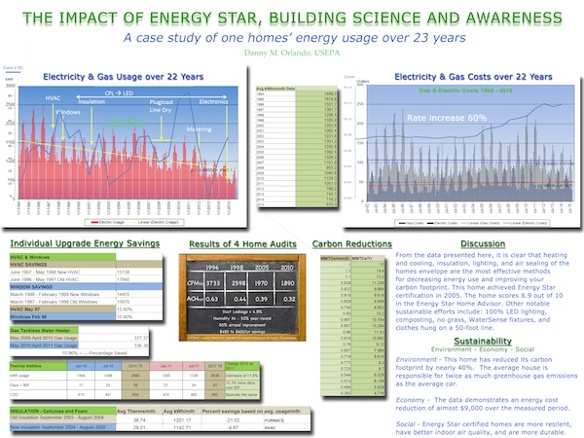
The image above is a poster with a lot more information and data about his home. If you can’t read it, you can download the full-size image (4.7 MB).
How did he do it?
He began with the HVAC system. Orlando was an early adopter of sealed combustion furnaces and put in a 96.6 AFUE unit. The air conditioner is 13 SEER, which was really good for 1997.
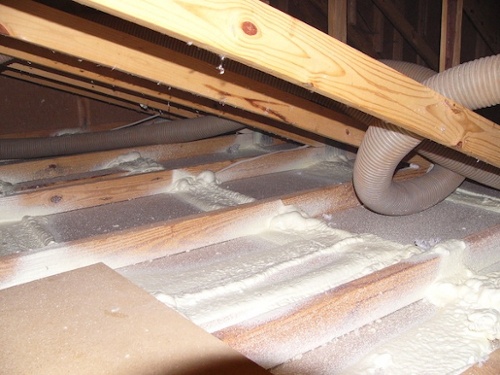
The he started with the building enclosure. What he did here was to attack the attic the right way. You don’t just insulate the attic and think you’ve done a great job. You’ve got to do the air sealing first. Look at that beautiful photo below! I always tell people, don’t insulate your attic…until you’ve done the air sealing. After he did the air sealing you see below, he had R-45 cellulose blown in there. (R-30 is the code requirement in Atlanta, where he lives.)
He also replaced the windows (U-value = 0.40 and SHGC about 0.57), installed a tankless gas water heater, and has gone to 100% LED lighting. And of course, he addressed the duct system and got the leakage down to 4 cfm25 per 100 square feet of conditioned floor area. For those of you not familiar with that metric, his leakage is half what is allowed by the Georgia energy code for new homes.
Saving energy over time
As you can see, when you live in a house long enough, you whip it into shape over time. Orlando has reduced his electricity consumption by 67% by steadily making improvements to his home and tracking the results.
That doesn’t mean you have to do it that way. If you can swing it, getting all the improvements done at once makes a lot of sense. In fact, I tell people you usually want to do the improvements to the enclosure before you deal with the HVAC equipment. You can’t always do that in an existing home, but if you can, you’ll be able to choose equipment more suited to the heating and cooling loads after you’ve air-sealed and insulated and possibly changed the windows.
Finally, let me tie this into my article on the duck curve. From a homeowner’s perspective, saving kilowatt-hours is a great thing. It reduces what you pay for energy. It makes your home more comfortable and healthful. But from a utility company’s perspective, the savings matter more if they occur at the right time. I interviewed Matt Golden this week and will say more about that soon.
Still, Danny Orlando’s home energy efficiency story is an impressive one. Cutting his electricity consumption by 67% is a great feat.
Allison A. Bailes III, PhD is a speaker, writer, building science consultant, and the founder of Energy Vanguard in Decatur, Georgia. He has a doctorate in physics and writes the Energy Vanguard Blog. He is also writing a book on building science. You can follow him on Twitter at @EnergyVanguard.
Related Articles
A 20 Year Old Energy Efficient House Goes to Net Zero in Florida
Energy and Power and Confusion and Consternation
Don’t Miss This Opportunity if You’re Replacing Windows
NOTE: Comments are closed.
This Post Has 12 Comments
Comments are closed.
Great article, Allison.
Great article, Allison. Appreciated.
Interesting presentation of a
Interesting presentation of a long term data acquisition. I wonder what happened between 11-12 to result in such a large decrease in consumption? Dramatic change.
Also, it we are to believe the graphing software, the average usage currently is more like 750kw, looking at the yellow trend line.
I have consumption data for 25 years as well and our usage delta is even more dramatic. I installed 24 PV panels and our consumption is a negative 2MW per year!
Thanks for the good work. Allison
Jonathan – costs between 2011
Jonathan – costs between 2011 and 2012 reduced due to 2011 had 88 days>90F and 2012 had 48 days>90F. I also installed the Black and Decker energy monitor and made an adjustment to the AC setpoint. And finally, my most energy using son moved out.
I’ve been doing something
I’ve been doing something similar for a number of years too. But I’m also including monthly heating/cooling degree days in the graphs as well as anecdotal notes. It helped me decide to re-sell a combo AC/dehumidifier I had in the basement one Summer due to a huge electric upswing.
@Danny, great story. I have a
@Danny, great story. I have a few questions if you don’t mind… What does the blue line on that graph represent? Also, could you elaborate on the Thermal Additive impact?
And finally, does the top graph (kWh) include gas consumption converted to kWh? I noticed that same graph on the poster is labeled Electricity & Gas Usage, however, consumption (especially this year) seems too low to include heat and dwh.
David – the blue line is days
David – the blue line is days>90F at Allatoona Dam #2 in Cobb County. The Permafrost by Powertron Global gave me a delta T of 2F and the supply temp is < 48F. The top graph is only kWh usage. I have a separate graph for therms.
I like a number of things
I like a number of things about Mr. Orlando’s work:
– It’s a celebration of work done and good results obtained. Bravo! Further, there’s explanation of what projects are driving results.
– I particularly like the spotting of events with time. I also do data tracking but I did not document projects in time and I’ve wished I had on several occasions.
– In our tracking, we keep temperature data and correct for degree days. It looks like Mr. Orlando tracks weather information also.
– The original electric usage of 20,400kwh/yr is substantial. Given it’s Atlanta, a fair amount was probably cooling. It makes me wonder what the house was like: size, age, key features, window area?
– I’m also impressed with the inclusion of air leakage data.
– The investment must have been substantial as well. We’ve been able to lower our electric usage to about 6,600 kwh/yr. I haven’t kept a record of the expenditures for energy reduction,but I’d guess it to be less than $3,000 over a 15 year period (not counting the cost of replacing a refrigerator that failed). Not everyone will opt for replacing windows, as an example.
– My compliments to Mr. Orlando for his inspiring work and to Mr. Bailes for recognizing a good topic to include in his most informative website.
The link to the full size
The link to the full size poster download it broken.
Sorry about that, Greg. I
Sorry about that, Greg. I just fixed it so you should be able to get it now.
Attic insulation – Was in an
Attic insulation – Was in an attic today and observed foam sprayed at roof deck. Not the best job however. Ceiling spaces between the joists were not insulated. This is my first encounter with foam insulation. Is the ceiling envelope breached? I think that it is. Attic temps can get very hot and can bleed through non insulated sheet rock/drywall between the ceiling spaces. Thanks, Ernie
Ernie, what makes you say the
Ernie, what makes you say the spray foam wasn’t the best job? If it’s just that there was no insulation on the attic floor, that’s not related to the quality of the spray foam job. It’s also how you want a sealed attic. You put the insulation at the attic, so that’s where you stop the heat flow. If you put insulation on the attic floor in addition to at the roofline, you can cause moisture problems in the attic in winter by keeping the sealed attic temperature lower. On cold days, the surface of the spray foam may be below the dew point.
Ernie wrote: “Attic
Ernie wrote: “Attic temps can get very hot and can bleed through non insulated sheet rock/drywall between the ceiling spaces.”
In addition to what Allison said…
No, attic will not be hot if roof is properly sealed and insulated. Depending on where you live, maybe 5 to 10 degrees warmer than house at worst, but closer to the house temperature on average.
That said, on the hottest days, an uninsulated ceiling will transfer a bit more heat to the house than with a vented attic and well sealed and insulated ceiling. The trade-off may or may not be positive. It usually depends on whether hvac is the attic, and how well ducts sealed/insulated. In new construction, I’m not a fan of encapsulated attics. I prefer a vented attic with tight ceiling, beyond-code blown-in insulation and all ducts inside conditioned space.