Do You Know Your Building Science Climate Zone?
One of the fundamental principles of building science is that buildings must be suited to their climate. When they’re not, problems can ensue. Maybe it’s just that they’re not as efficient as they should be. Maybe it’s worse. Put plastic between the drywall and framing of your exterior walls in Ottawa, and it can help control vapor drive from the interior air and its associated moisture problems (rare except in extremely cold climates). Put that plastic in the same place in Georgia, and you’re going to rot the walls.
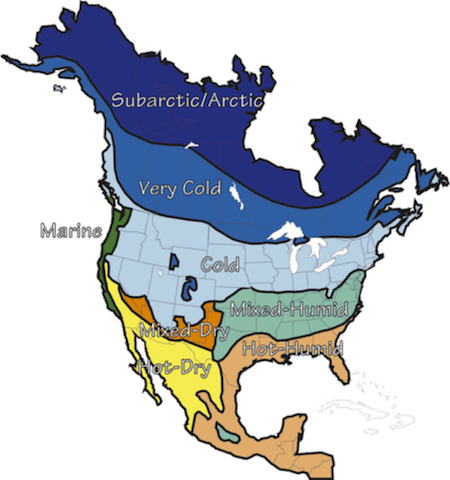
The first thing to know about climate zones is that we divide them up based on two parameters: temperature and moisture. The map above, from Building Science Corporation, is one that seems to be in a lot of the curricula for home energy rater and other energy auditor classes. The fancy word for this type of division is hygrothermal, and Building Science Corp. has a nice interactive map of hygrothermal regions.
The map above divides all of North America into broad regions based on temperature and then humidity. My friend and former colleague Mike Barcik likes to say that the color of the zone shows what color your skin turns in winter.
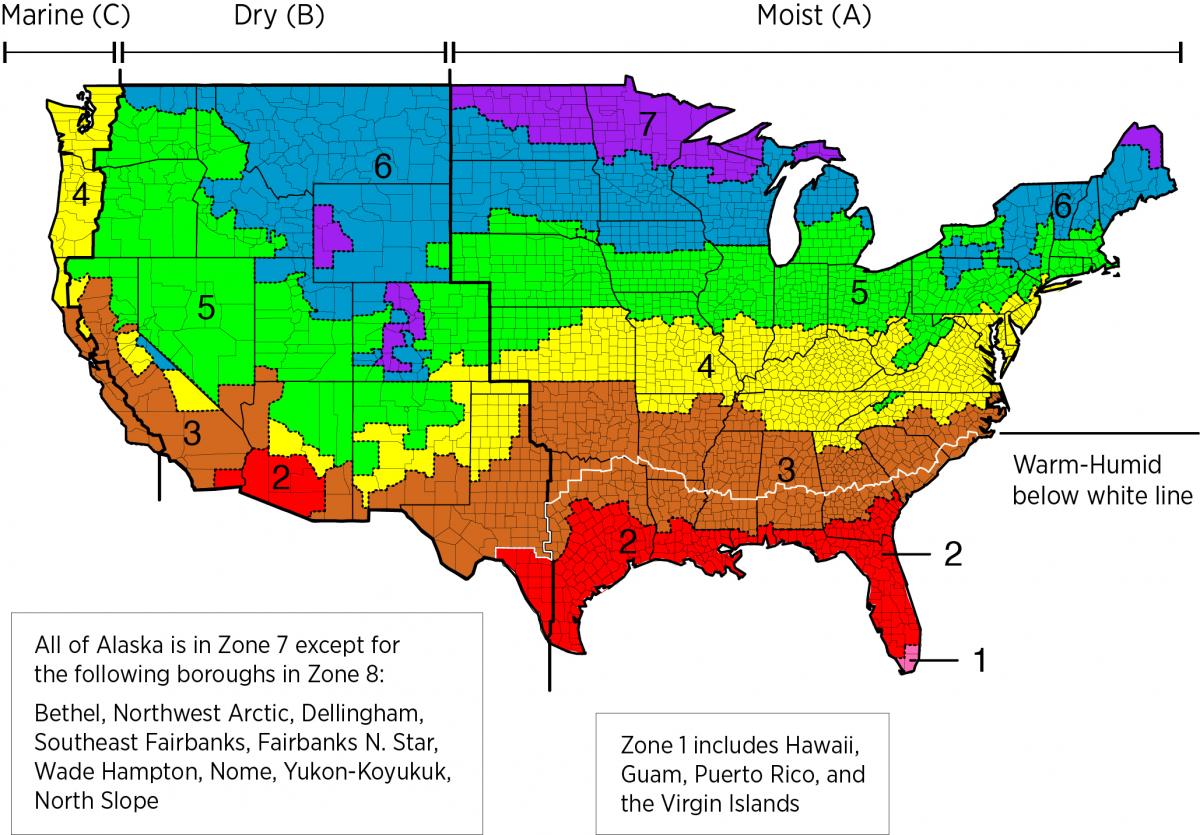
The International Code Council has a more fine-grained and quantitative approach to climate zones in the US,† as shown in the map below from the International Energy Conservation Code (IECC). (Click on the map to see an enlarged version.) Each zone has a number, starting with 1 for the hottest US climate, the southernmost tip of Florida, and going up to 8, the coldest parts in Alaska.
Temperature divisions
The number of each zone tells you how warm or cold it is. I wrote above that temperature is the parameter, but that’s not a full description, of course. It’s not just how cold or how hot the place gets. It’s based on accumulated temperature calculations called degree days. Basically, degree days combine the amount of time and the temperature difference below some base temperature.
For example, the most common base temperature for heating is 65° F. If the temperature stays at 55° F for 24 hours, you’ve just accumulated 10 heating degree days (HDD). It’s the same for cooling degree days (CDD). The IECC uses 50° F for the cooling base temperature, so if the temperature is 90° F for 24 hours, you’ve got 40 CDD. For heating and cooling, you add up the total number of HDD or CDD for the whole year, and that tells you how hot, cold, or mild the climate is. (A great source of data for degree days is the degreedays.net website. Check it out.)
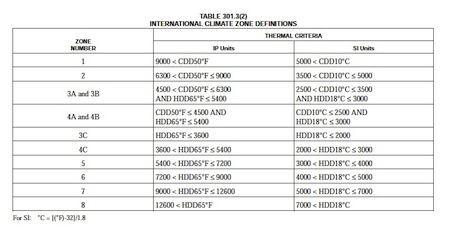
The table above (click for enlarged version) shows how the IECC uses the number of cooling degree days for climate zones 1 through 4 and the number of heating degree days for climate zones 3 through 8. In zones 1 and 2, cooling is the only important factor. In zones 3 and 4, it’s heating and cooling. In zones 5 and higher, it’s all about heating. Atlanta has about 3000 HDD (in ‘those annoying imperial units’) and is in climate zone 3.
Moisture divisions
Notice that the IECC map also shows how moisture impacts the climate zones. Generally, it’s moist to the east, dry to the west, and marine along the West Coast. I remember driving across Texas, from west to east, in the summer of ’88 and feeling the humidity hit us when we crossed that black line. At the time I had no idea what that big black line was when we drove over it, but now it’s clear.
People have known about that line since the 19th century, as a matter of fact. It lies pretty close to the 100th meridian of longitude, and divides the part of the US that gets enough rain to farm without irrigation from the dry side that requires irrigation.
The three main moisture divisions are:
- Moist (A) This is designated by the letter A after the climate zone number. Here in Atlanta, we’re in climate zone 3A. The primary factor is precipitation. If it doesn’t meet the dry climate definition below, it may be moist. The other necessary condition is that it’s got to fall outside the marine climate conditions.
- Dry (B) This is based on the amount of precipitation and the annual mean temperature. The calculation is 0.44 x (TF – 19.5), where TF is the annual mean temperature in degrees Fahrenheit. If the annual precipitation is less than the number you get, it’s a dry climate and the zone number has a B after it. El Paso, Texas, for example, is in climate zone 3B.
- Marine (C) This is the Goldilocks climate, in a way. It’s not too hot in the summer (warmest month mean temperature < 72° F), not too cold or too warm in winter (between 27 and 65° F), has at least four months with mean temperatures above 50° F, and has its dry season in the summer. We’re talking Santa Barbara (3C), Portland (4C), and Seattle (4C).
Actually, there’s a 4th moisture division shown on the map. Notice the white line going horizontally across the Southeast. It divides the eastern, moist side of the US into moist and moister, basically. This division isn’t based on precipitation, though. It’s based on humidity. A climate zone is called warm-humid if the wet bulb temperature is:
- ≥ 67° F for 3000 hours or more
- ≥ 73° F for 1500 hours or more
It’s all in the IECC
Wherever you read building science, you’re likely to run into someone talking about climate zones, and if you don’t know the exact definitions, it can be a bit confusing. Now you’ve got my little summary here, but you can always get yourself a copy of the IECC as well. Most states are still on the 2009 version. Maryland and Illinois have moved up to the tougher 2012 already. The climate zone definitions are the same in both versions. In addition to the basic definitions above, the IECC also tells you county-by-county what the local climate zone is.
Now get out there and design, build, and renovate in ways that work for your climate.
Footnote
† The International Code Council is based in the US and, like the World Series, has little foothold outside our borders. Although the IECC climate zone map here shows only the US, you can use the definitions of the climate zones for any location in the world. For example, most of Canada is in climate zone 70. Just kidding. Most Canadians probably live in climate zones 5 and 6. By looking up heating degree days on degreedays.net, I found the following: Climate Zone 4C – Vancouver; CZ 5A – Toronto; CZ 6A – Ottawa, Montreal, Quebec; CZ 7B – Calgary.
Related Articles
You Don’t Need a Vapor Barrier (Probably)
This Winter Is 37% Warmer than 2010-11 (by Heating Degree Days)
Image credits: North American climate zone map from Building Science Corporation. IECC climate zone map and table from International Code Council.
This Post Has 3 Comments
Comments are closed.
How does a consumer find HVAC
How does a consumer find HVAC dealers who understand this information and how it determines the best system design? I live very near that white line between humid and swampy, and we struggle to keep the indoor humidity below 50%. Throw in allergies and one compromised immune system and you have potential for disaster. I’m looking at ventilating dehumidifiers, knowing that I’ll have to learn everything I can in order to teach my contractor & HVAC guy. If you know any good HVAC contractors in central AL, please let me know.
How do we convince HVAC
How do we convince HVAC contractors that a 40-50k furnace (smallest you can buy) is sufficient to heat just about any house in climate zone 1, 2, or 3?
Pls help. We live in northern
Pls help. We live in northern virginia and we have so opinions on wether to have jsut a heat pump or add a secondary heat source, propane.