Another Down Year for Heating Degree Days
We’ve had some beautiful, cool weather here in Atlanta the past couple of days. It’s about 50° F outdoors as I write this. The high yesterday was only about 70° F. We’re getting a few more heating degree days (HDD) in the middle of May. (Heating degree days are really just another way at looking at temperature, which I explained in more detail in a look at the fundamentals of degree days.) We occasionally pick up some even in July and August. But it’s the winter HDD that matter for heating — and that give us a clue about the climate.
Here are the heating degree days for Atlanta over the past ten years.
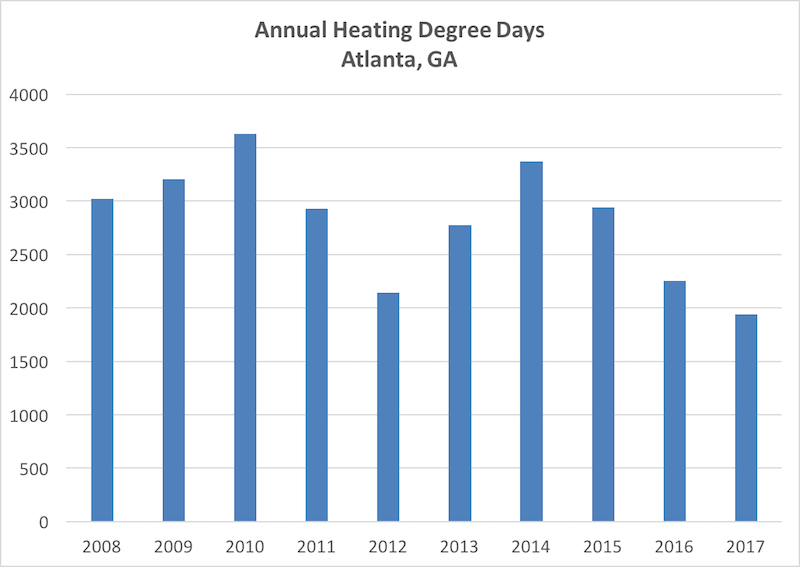
Our average number of heating degree days is about 3,000. This year, at less than 2,000, we’re at about two-thirds our average. Since the polar vortex of 2014 (remember that?), we’ve been down every year.
It’s not just us either. This was a banner year for snow out West. I got an email recently about a couple of ski resorts that will keep the lifts running into the summer. But the temperatures were higher, the heating degree days lower. Here’s a look at 21 years of heating degree days for Aspen.
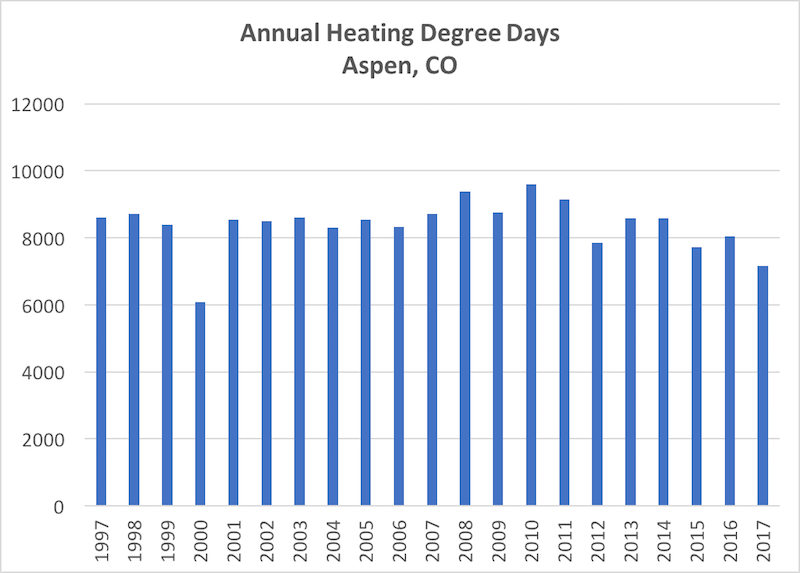
Aspen’s long-term average is about 9,000 HDD. This year they got 7,165 through April. Now, weather ain’t climate, so you can’t look at one year or even two or three and draw long-term conclusions about climate. Since 2010, however, we sure are having a lot of mild winters. That’s great for heating bills, not so great for skiing.
Of course, this has nothing to do with our atmosphere hitting the 400 parts per million level of carbon dioxide. Right? That climate change stuff is just a theory.
Related Articles
The Science of Global Warming Is Older Than Quantum Mechanics
This Winter Is 37% Warmer than 2010-11 (by Heating Degree Days)
The Fundamentals of Heating and Cooling Degree Days, Part 1
NOTE: Comments are moderated. Your comment will not appear below until approved.
This Post Has 8 Comments
Comments are closed.

Thanks Allison. Love your
Thanks Allison. Love your articles. Happy to note you didn’t refer to it as the Canadian polar vortex! 😉
Last I heard some theories
Last I heard some theories are true. Time may tell.
Andy Unfortunately we will
Andy Unfortunately we will all be dead by the time of the worst of it. Only future generations will be constrained to suffer with our folly.
Allison, as you are aware,
Allison, as you are aware, the cooling degree days have increased significantly as well.
We looked at 167 National Solar Radiation Data Base Class I stations’ daily data for the 62 years from 1960 through 2012. It found a generally increasing trend in ambient temperatures that resulted in increasing CDD year over year.
This finding is significant because it is not uncommon for evaluations to use published CDD or CDD’s derived from TMY3 to “Normalize” the results of evaluations. These methods are also used to project usage and savings results into the future.
For most locations, any method that uses an average of cooling degree days over some time period will necessarily result in an erroneous conclusion. It is simply true that, for most locations, there is a rising number of CDD (and a falling number of Heating Degree Days). For these reasons evaluations should take into account this “new normal” in normalizing the results and for projections into the near future. One example of the trend in CDD is shown in Figure 1. This figure also shows the inaccuracy associated with a CDD that is based on an average over a number of years.
Figure 1. Actual and TMY3 Generated CDD (base 68ºF) vs. year for Reno, Nevada
There is statistical significance to the increase of cooling degree days per year. The values of the change in CDD68 per year range from -0.16 (t value -0.16) for Cedar City, Utah to +26.97 (t value 10.7). Figure 2 shows the values of change in CDD68 per year.
Figure 3. Values for the coefficient of year in the regressions
ALLISON I CANNOT FIGURE OUT HOW TO INSERT GRAPHS.
John
Southeast Arizona (Sierra
Southeast Arizona (Sierra Vista) is trending very differently since 2001. HDD is trending flat with relatively high variance, while CDD is clearly trending lower. Yes, I said lower. Take a look:
HDD: bit dot ly/2pXSVo9
CDD: bit dot ly/2pVaBAC
(I have to disguise the links to get past this blog’s overly aggressive spam filter)
Climate change affects different regions in different ways. Some areas are trending wetter, some drier. Some areas are trending warmer, some cooler. These changes are the disruptive result of global warming on regional climates.
The question I must ponder is to what extent a downward trend in CDD in a given area should be factored into energy evaluations.
I live just outside
I live just outside Manchester, NH and my figures were cooler this year, with the warmest back in the 2011-2012 heating season (November through April).
I have used some different heating solutions and track which is best by COST PER DEGREE DAY. First year with Mini-Split (Mitsubishi FE12NA) was by far the best, but it developed a slow leak and it has been temperamental. In 2015 Oil prices went way down ($1.56/Gal!), so heating costs were close to Mini-split. I have an easy very accurate way of recording heat KWH and oil use daily. Figures below are from a large spreadsheet I have kept for several years:
Season DD Gal Oil Heat KWH Total $$ Cost/DD
2016-17 5666 200.3 921 $454.44 $0.080
2015-16 5434 133.3 1565 $455.02 $0.084
2014-15 6575 12.3 4146 $729.70 $0.111
2013-14 6432 34.6 2160 $423.15 $0.066
2012-13 5495 169.7 1283 $797.69 $0.145
2011-12 4767 193.7 861 $810.54 $0.170
2010-11 5725 372.2 none $1,037.13 $0.181
2016-17 1 Mini-split plus oil(Mini failed Nov, fixed March)
2015-16 1 Mini-split plus oil
2014-15 2 Mini-splits (main one not fully charged)
2013-14 Mostly mini-split, some oil
2012-13 Oil plus Space heater daytime
2011-12 Oil plus Space heater daytime starting Jan 1
2010-11 Oil only
In the spreadsheet I track actual costs but also can also enter a global cost for Oil or Electricity which allows seeing which heating source would be most economical with different utility costs. This is just a snapshot; many other variables!
I think we need to invest
I think we need to invest trillions of dollars into plate tectonics because our climate requires that the continents stay in place.
This is a T-shirt I’ve had
This is a T-shirt I’ve had for over 20 years now:
[[{“fid”:”2207″,”view_mode”:”default”,”fields”:{“format”:”default”,”field_file_image_alt_text[und][0][value]”:”Stop Plate Tectonics T-shirt”,”field_file_image_title_text[und][0][value]”:”Stop Plate Tectonics T-shirt”},”type”:”media”,”field_deltas”:{“1”:{“format”:”default”,”field_file_image_alt_text[und][0][value]”:”Stop Plate Tectonics T-shirt”,”field_file_image_title_text[und][0][value]”:”Stop Plate Tectonics T-shirt”}},”attributes”:{“alt”:”Stop Plate Tectonics T-shirt”,”title”:”Stop Plate Tectonics T-shirt”,”class”:”panopoly-image-original image-style-panopoly-image-original media-element file-default”,”data-delta”:”1″},”link_text”:null}]]