The 2013 ACEEE State Energy Efficiency Scorecard: No A’s & 43 F’s
If the annual scorecard for state energy efficiency just published by the American Council for an Energy Efficient Economy were a list of test scores, here’s how the grade distribution would look for the 50 states plus the District of Columbia:
If the annual scorecard for state energy efficiency just published by the American Council for an Energy Efficient Economy were a list of test scores, here’s how the grade distribution would look for the 50 states plus the District of Columbia:
- 2 B’s
- 4 C’s
- 2 D’s
- 43 F’s
For the optimists out there, that means there’s a whole lot of room for improvement!
As with previous versions, the ranking system is based on the following categories, with the total possible points for each category shown in parentheses:
- Utility and public benefits programs and policies (20)
- Transportation policies (9)
- Building energy codes (7)
- Combined heat and power (5)
- State government initiatives (7)
- Appliance efficiency standards (2)
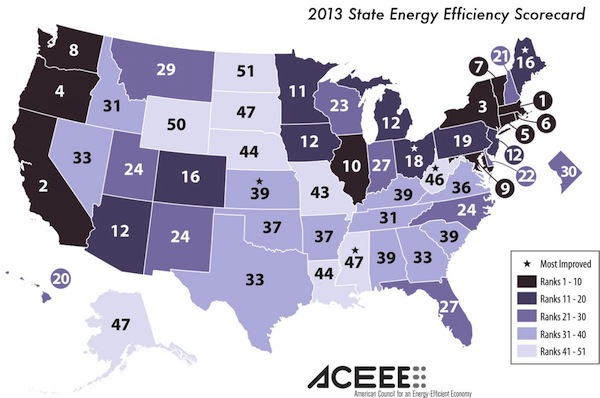
Massachussetts and California are the two states that got a B on the test. New York, Oregon, Connecticut, and Rhode Island got Cs. Vermont and Washington each got a D. If you don’t see your state among those 8, you’re in the vast majority of us who live in states with failing grades…errrr…I mean, great opportunity.
My state, Georgia, held steady with its ranking as #33 in the US but lost a point this year. That puts us at 13 out of 50 points for a whopping 26%. Last year, we were tied for 6th place in building energy codes with 4.5 out of 7 points, but we’ve slipped to 19th place with 4 out of 7 points this year. That’s because we’ve been resting on our laurels with our adoption of the 2009 IECC in 2011. We were the first state to require home builders to pass a blower door test, but our state energy code task force has been dormant since then.
One thing the report changed for this year was beefing up the scoring for building energy codes to include more information about compliance and enforcement. They acknowledge the difficulty of this task and describe how they went about it on pages 58-59 of the report. They also have a nice section on the impact of the American Recovery and Reinvestment Act (ARRA) on building energy codes.
Finally, for those of you who lean libertarian and see the ACEEE’s rankings as a ‘State Intrusion Scorecard,’ as one commenter wrote last year, all I can say is get over it or move on to another article. Yes, the government can be intrusive, but the NSA’s spying program is a much better target for your ire. Implementing policies to promote energy efficiency is, overall, a good thing.
It’s another great report (176 pages long), full of information about the state of our energy efficiency policy in the US. As you can see from the ‘grade’ distribution above, though, we still have work to do.
Related Articles
ACEEE’s 2012 State Energy Efficiency Scorecard Has Your Number
Where Does Your State Rank in Energy Efficiency? ACEEE Can Tell You
This Post Has 3 Comments
Comments are closed.

Thanks for passing this along
Thanks for passing this along, Allison.
Finally, a list where my home state of Nevada does not rank at the bottom!
Best wishes
Allison –
Allison –
You know, coming from Massachusetts, if we’re number 1 . . . Holy Mackerel! I always feel that we’re way behind everyone else. I haven’t got a clue why we’re number 1. Maybe I should look at the report!
75% of all electric homes in
75% of all electric homes in Oklahoma are heated with resistance heat air handlers!! No wonder we did so bad..