Calculating the Global Warming Impact of Insulation

Everyone knows about the impact of burning fossil fuels on global warming. Maybe not everyone believes it, but scientists first started focusing attention on increasing carbon dioxide levels way back in 1827. The impact of insulation on global warming, however, is relatively new. About a decade ago, Professor L.D. Danny Harvey started looking at the effect of blowing agents released by the production and use of some foam insulation types. Then Alex Wilson picked it up in 2010. At the 2016 North American Passive House Conference, I presented my views on this topic. I wrote about the first part of my talk in my last article. Today, I cover the part about using David White’s global warming tool for insulation.
Background
In his calculations, Alex Wilson chose one scenario. He looked at the global warming impact for a house heated with a natural gas furnace. He chose a cold climate with 5,000 heating degree days (HDD), and he didn’t include cooling. The resulting payback showed how long it would take to save enough energy to offset the global warming emissions from the embodied energy in the insulation and from the release of blowing agents with global warming potential (GWP). He looked at several different insulation types and a range of R-values.
The first part of my conference presentation covered what I see as the main flaw with his payback calculations. In the second part, I discussed David White’s spreadsheet tool for calculating the global warming impact of insulation. The nice thing about his calculator is that you can change a lot of the variables and see what the effects are.
I showed three scenarios in my conference presentation. I’ll put them in a different order here, beginning with the gas furnace. If you download the presentation file (pdf), you’ll find the two for heat pumps before the one for the furnace.
Gas furnace
Here’s the output from David White’s calculator for the gas furnace.
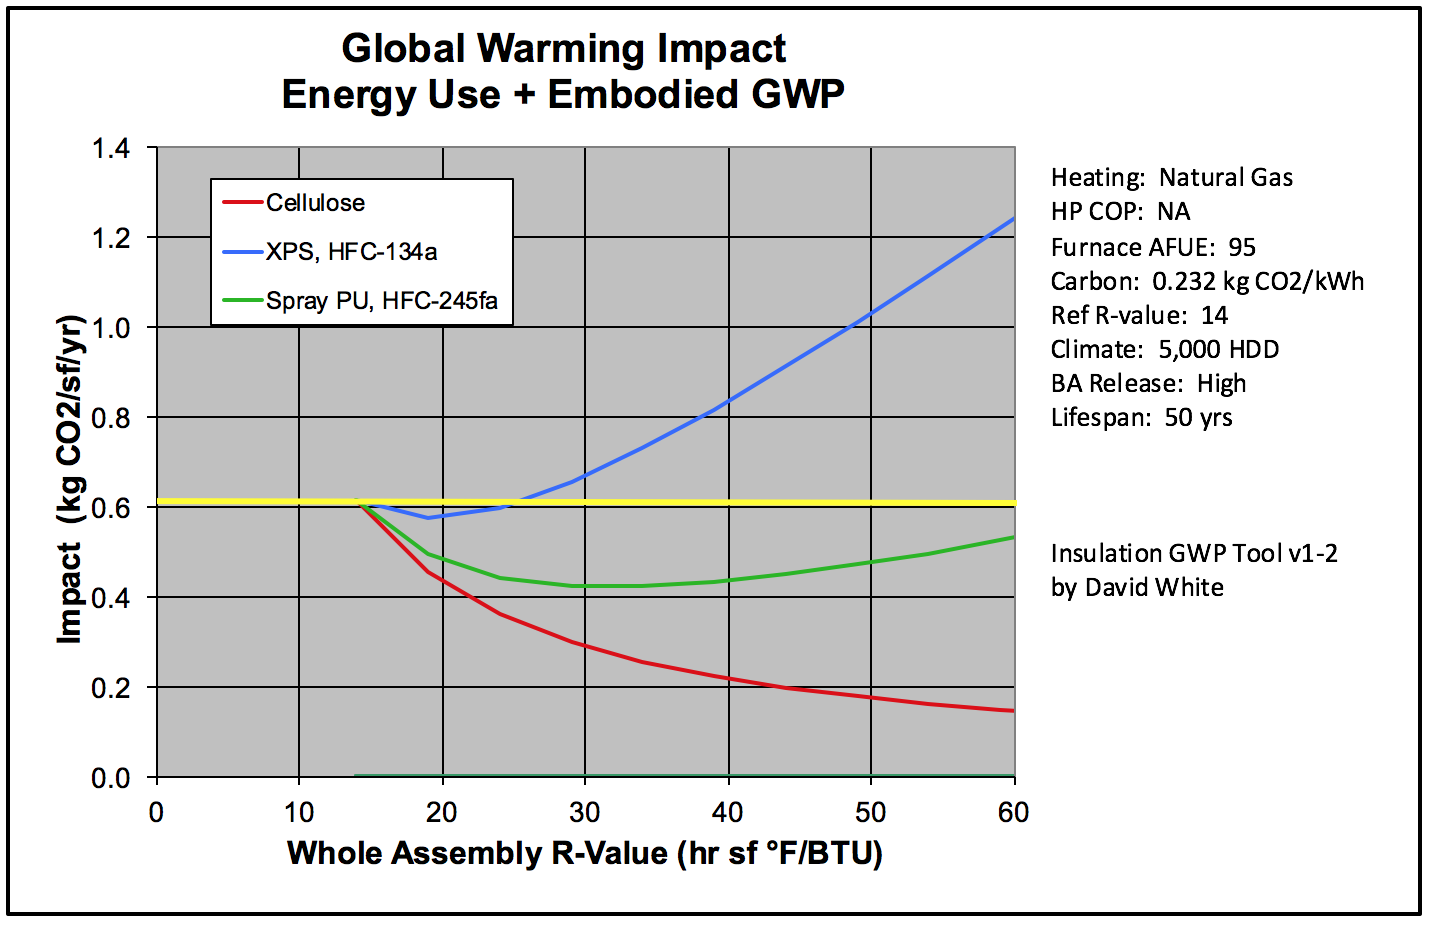
There’s a whole lot going on here, so let me first give you the lay of the land. This tool doesn’t calculate payback. Instead it calculates global warming impact, as measured by the kilograms of carbon dioxide emitted per square foot of wall area per year (kg CO2/sf/yr). That’s on the vertical axis. On the horizontal axis is the total R-value of the assembly. To the right of the graph, I posted a sidebar with the main inputs I used.
One important thing to note: I used version 1-2 of White’s tool. It doesn’t include cooling. PHIUS has version 1-3 on their website, and it has the ability to include cooling energy in the calculations.
Let’s dive into the results now. There are three curves on the graph. They show the GW impact for cellulose (red), closed cell spray polyurethane foam, ccSPF (green), and extruded polystyrene, XPS (blue). The calculator has a lot more options for insulation types, but I chose these three since they capture the important differences. Most of the others are similar to cellulose.
I chose a reference R-value of 14. That matches what Wilson did in his calculations and means that we already have a wall equivalent to 2×6 cavities insulated with cellulose. The whole-wall R-value of that assembly is about 14. On the graph above, the three curves all begin at R-14.
It’s what happens when add more insulation beyond the R-14 that gives you some guidance here. In this case, all three see their global warming impact drop as you go up from R-14. But cellulose has a different behavior than the other two. It just keeps dropping whereas the other two hit a minimum and then begin rising again.
For ccSPF, that minimum occurs in the mid-R-30 region. As you add this insulation type, the global warming impact keeps getting better and better until you’ve added about R-20. That would be about 3″ of ccSPF.
For XPS, the minimum comes more quickly, at about R-19. Once you add about R-5 (or 1″) of XPS, the global warming impact begins to rise.
When I discussed using this tool with David White and others, most believed that if you’re going to use XPS or ccSPF, you shouldn’t go further than the minimum. I drew the yellow line on the graph, however, to show where the net effect of adding XPS or ccSPF goes from positive to negative. With XPS, you can add about another R-5 before your assembly becomes worse for global warming than if you hadn’t added any extra insulation at all. With ccSPF, it’s beyond R-60, which, at about 7 inches, is also beyond the point that most people would use this type of insulation.
Electric heat pump with “clean” electricity
Now let’s look at the results for a heat pump. First, here’s the scenario for a house that uses “clean” electricity.
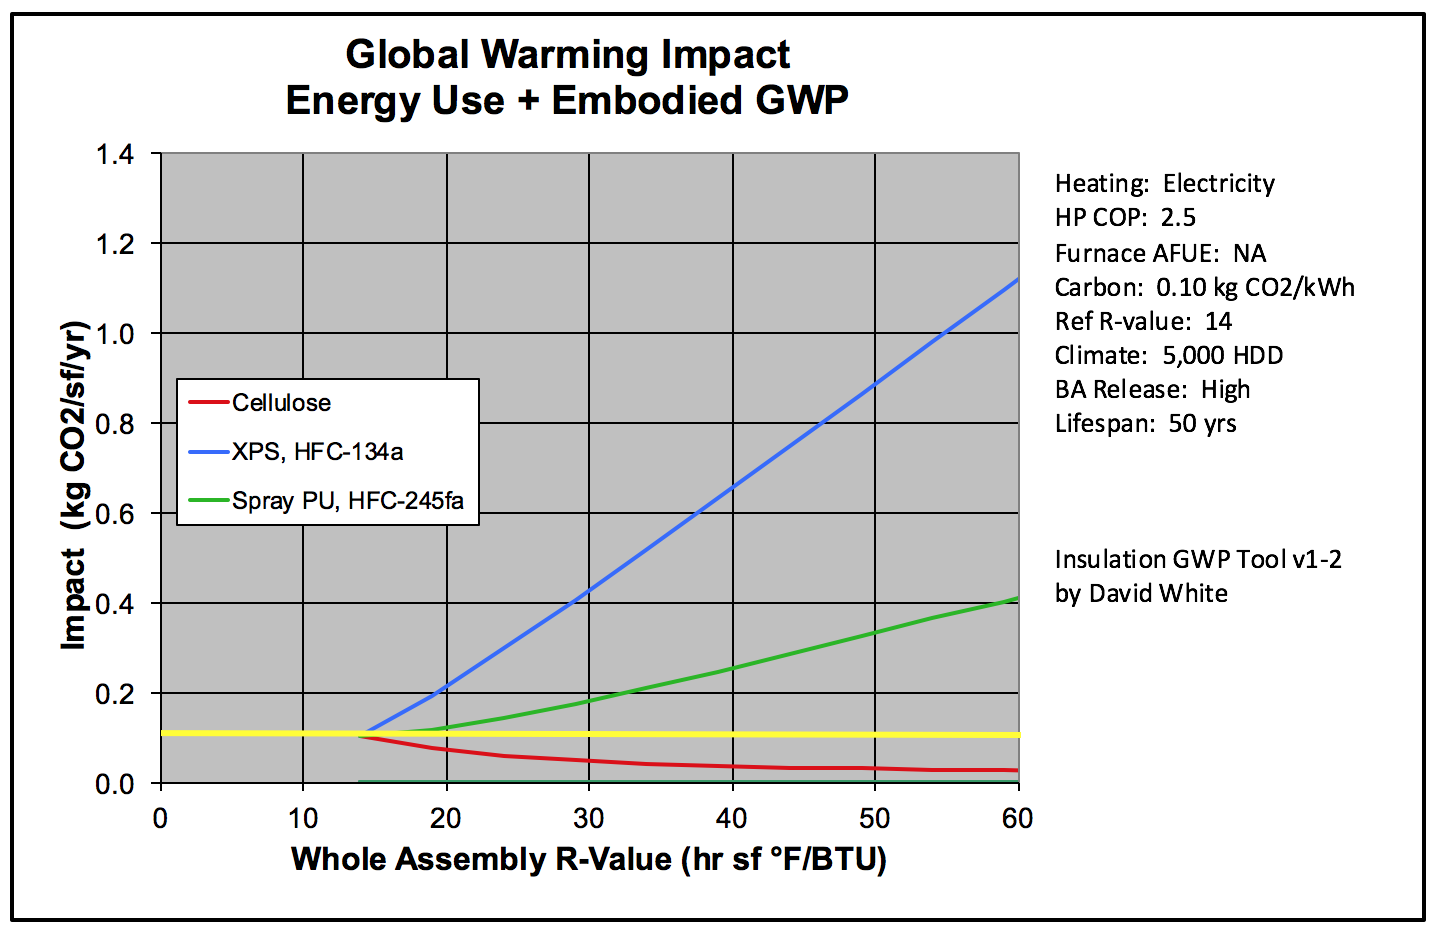
I wrote an article in September about the carbon intensity of electricity by state. I posted an expanded version of the article that included carbon intensity by regional interconnect. The state data show a wider range than the regional data, varying from less than 0.1 kilograms of CO2 per kilowatt-hour produced up to about 0.95 kg CO2/kWh. In this analysis, I called the “clean” electricity that which had a carbon intensity of 0.1 kg CO2/kWh and the dirty electricity that with 0.95 kg CO2/kWh.
Clearly, the cleaner the electricity, the less you can affect affect global warming emissions by saving energy. In the graph above, notice how low the yellow line is. As the the three insulation curves diverge from the R-14 starting point, only the cellulose makes sense here. (Again, there are a lot of other insulation types that perform similarly to cellulose. I just haven’t shown them here.)
Electric heat pump with “dirty” electricity
With dirty electricity, the effectiveness of insulation is much better.
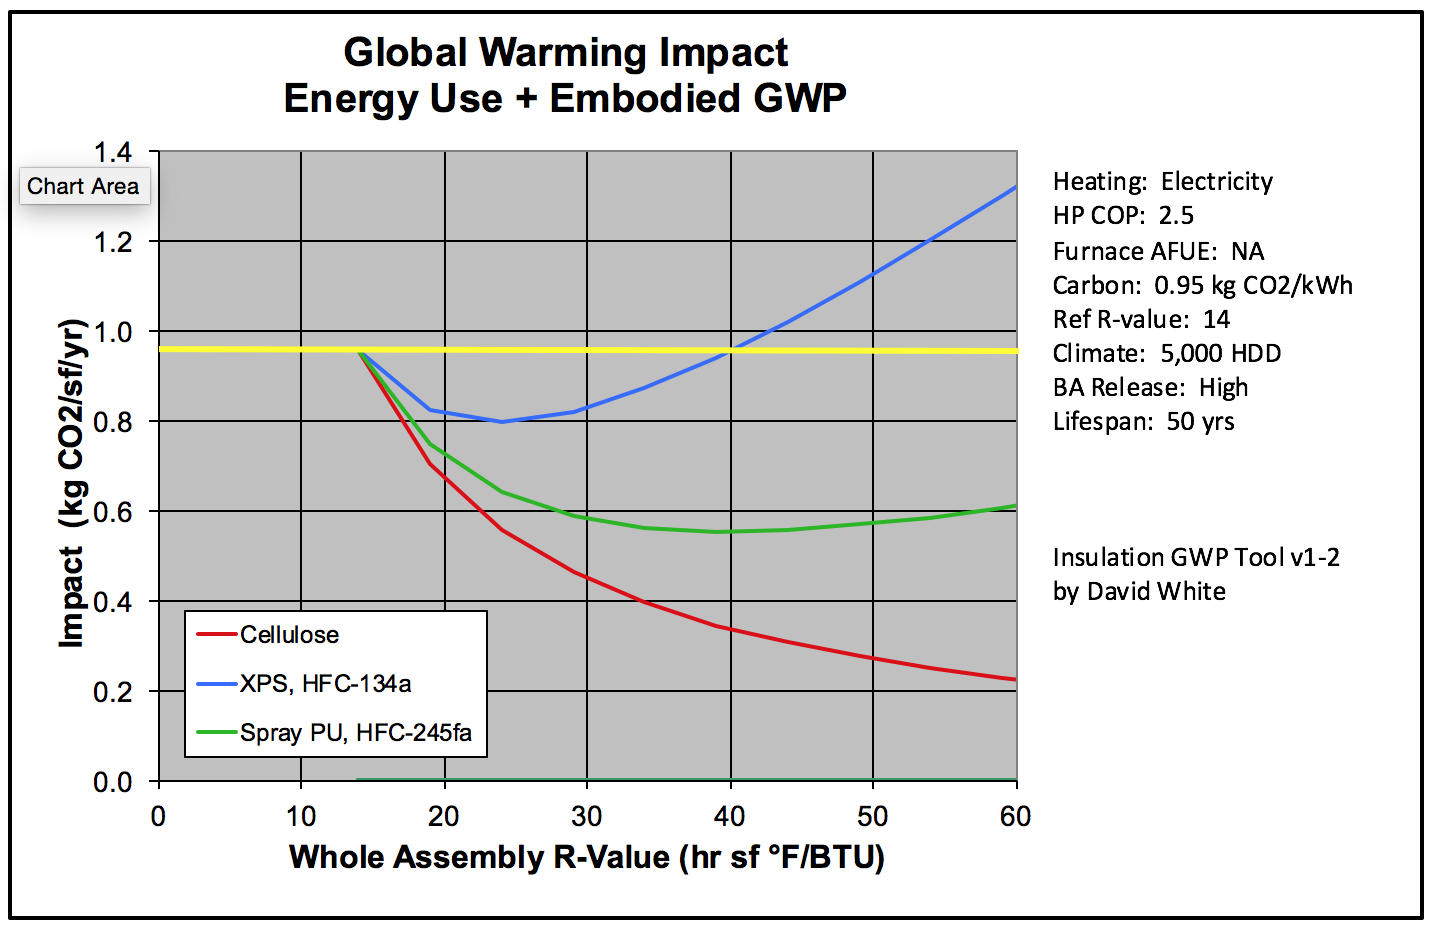
As in the previous two graphs, the cellulose curve keeps going down. The more you use, the more you decrease the global warming impact. With ccSPF and XPS, however, there’s a minimum and then a rise. For XPS, the sweet spot is at about R-25, so you could add about 2″ for another R-10. For ccSPF, the minimum is about R-40, so you could add 3 to 4 inches for another R-25 or so.
To stay below the yellow line, you’d want to limit XPS to about R-25, or 5″. You could go beyond R-60 total with ccSPF, but why would you want to? In my last article, I showed that unless you’re in a really severe climate, you could even achieve Passive House walls with R-50 or less.
Conclusions
This global warming calculator from David White is a useful tool. Rather than trying to calculate payback, it gives you the numbers for global warming impact. You can look at the curves for different insulation types and see where your sweet spot is. One thing I think would make it even better would be if it allowed you to look at the effect of an entire assembly instead of just individual insulation types with a reference R-value.
If you download my presentation slides, you’ll see these conclusions:
- GW impact isn’t as simple as it seemed
- Blanket condemnation of XPS & ccSPF based on payback not warranted
- Avoid XPS
- Use ccSPF with other blowing agents
- Use David White’s calculator for more refined guidance
The big one there is in the middle: Avoid XPS. In terms of global warming impact with the HFC-134a blowing agent, it’s the worst. It’s also relatively easy to substitute another type of insulation for XPS. On walls, you can use mineral wool or polyisocyanurate. For slabs, you can use expanded polystyrene (EPS) or mineral wool. So just use something else.
Manufacturers are tight-lipped about what blowing agents they’re using these days. Some of the spray foam companies have switched over to the next generation blowing agents with much lower global warming potential. I don’t know of XPS manufacturers who have announced changes, but a rep from manufacturer did tell me they’re not using HFC-134a anymore. When I asked what they used, he said, “I can’t tell you that.”
In general, all insulation types can help mitigate the effects of climate change. Types with the bad blowing agents, however, have limits to their effectiveness. If you’re planning to use XPS or closed cell spray foam, this tool from David White can help you decide where to draw the line.
Related Articles
Insulation and Global Warming at the Passive House Conference
How Dirty Is Your State’s Electricity?
The Science of Global Warming Is Older Than Quantum Mechanics
NOTE: Comments are moderated. Your comment will not appear below until approved.
This Post Has 10 Comments
Comments are closed.

Count us in the “new and
Count us in the “new and improved group” using the new greener blowing agents whose line would fall between your cellulose and the CCPU fa245 line. But what is significantly misleading about your chart is that all lines start from the same point – R14. If you were to use a 2×6 wall with ccspf you would be looking at a whole wall R value that was much higher than what 2×6 with cellulose could offer. And if you only stopped with 2″ of ccspf to reach your R14 then you have huge open air cavities inside the wall which are not doing anyone any good.
So I am basically in agreement with what you are saying, but the presentation of the data presents a false equivalency that I hope would not be encountered in the real world.
R14 is but a reference point.
R14 is but a reference point. You’re looking at what ~R30 using ccSPF in a 2×6 wall? The graph covers that.
As the principal code
As the principal code official in NY State says in meetings, code it the lowest quality minimum. As architects we should never abide by it but use our training to give clients meaningful product. That includes going close to passive as it allows several aspects. Minimal heating and cooling (thus saving on maintenance and equipment wear and tearalone) with totally superior comfort, AND savings in average home in 30 year mortgage 250 000 to 500 000 dollars.
Very interesting. I’m curious
Very interesting. I’m curious, what about air leakage? Obviously closed cell does a pretty amazing job with that. I’ve become a big fan with existing homes. It’s tough to do a good retrofit without it. My minimum leakage reduction in the last 2 years is 35%, the max is 75%. How much might that affect things? Could ccSPF come out ahead?
Air leakage introduces
Air leakage introduces another variable that’s basically out of the scope of this particular post. Of course if (that’s a BIG IF) properly applied ccSPF does a great job for air sealing, but it’s a Band-Aid for a poorly assembled enclosure.
Thanks for the info. If
Thanks for the info. If people want to go “all out” they should look at Athena Impact Estimator. It will give you global warming potential, acidification potential, human health respiratory effects potential, ozone depletion potential, smog potential, and eutrophication potential. The Impact Estimator additionally reports fossil fuel consumption.
The software is free and is regionally customized and fairly easy to use.
You can find it here (http://www.athenasmi.org/our-software-data/impact-estimator/)
If you are a spreadsheet junkie try their Ecocalculator
( http://www.athenasmi.org/our-software-data/ecocalculator/ ) it is not as broad as the Impact estimator but gives you good data.
Author: Have you heard or
Author: Have you heard or read about Hempcrete? Sustainable Insulation Material that withstands fire, insects, etc. Walls, floors, ceilings and yes even wall assemblies. I would be interested in seeing “natural vs man-made” energy stats if you want to delve into something truly sustainable. If you need info on Hempcrete, I’ll gladly share. Peace and Thank you for addressing the “blowing agents” true cost to the climate. Scotty
Allison, I think the blowing
Allison, I think the blowing agents that you are showing at least for the XPS and maybe for the Spray Poly are no longer in use by those manufacturers.
@Allison, I agree that unless
@Allison, I agree that unless and until XPS manufacturers come clean on blowing agents, we should assume worst-case. Your XPS curves are based on HFC-134a, right?
However, I disagree with blanket advice to avoid XPS. With the exception of the HP/clean electricity scenario, your graphs demonstrate that XPS has a net-positive GWP impact up to a point. In particular, if we assume non-foam insulation in the cavities with XPS exterior insulation (a very common configuration), incremental increases to both cavity and continuous R-values should remain well under the XPS inflection point for most projects.
OTOH, when designing a home with clean grid power or on-site renewable energy, I agree that those who care about GWP should consider other options, or press XPS manufacturers to come clean on their blowing agents.
I’ve read through the
I’ve read through the articles between you and Alex. Played around a little with spreadsheet but not sure all of its assumptions and if it would lead me to the answer I’m looking for..
I’m trying to get my head around the impact of insulating basement walls with 4” – of XPS versus GPS.
I know GPS would be the go-to. But it’s an hour drive one way to the supplier that can order it for me, and costs double the amount of XPS at a big box 5 mins from my house. Even more if I have them deliver.
Based on all your research, how much of a difference would there be in these two choices?
The extra carbon that went into making money for the price difference and pickup/deliver mileage..would GPS be worth it in climate zone 5?