Cooling Load Variation With Changing Temperatures

Sizing an air conditioner (or heat pump) shouldn’t be left to guesswork. That’s why we have engineering protocols like ACCA Manual J for calculating the amount of cooling load a house experiences. Among the factors that contribute are the outdoor and indoor temperatures. But how much cooling load variation do you get if you use inputs other than the design temperatures? Let’s look at an example.
Outdoor temperature
I’ve written quite a bit about the house I bought in 2019. The most recent article was about how well my Mitsubishi heat pump performed in the arctic blast last December. Before that I wrote about how well it did in last summer’s heat wave. Today, I’ve got some modeling data for you about cooling load variation for my house using the load calculation I did when I did the HVAC design in 2019.
First, let’s look at how the total cooling load (sensible plus latent) changes when I change the outdoor dry bulb temperature. The graph below shows the results. The starred point is the reference for all the other data shown. That’s the design cooling load based on the 1 percent outdoor design temperature of 93 °F. The horizontal axis shows excursions from the design temperature in degrees Fahrenheit. The vertical axis shows the percent change in the cooling load as the outdoor temperature varies.
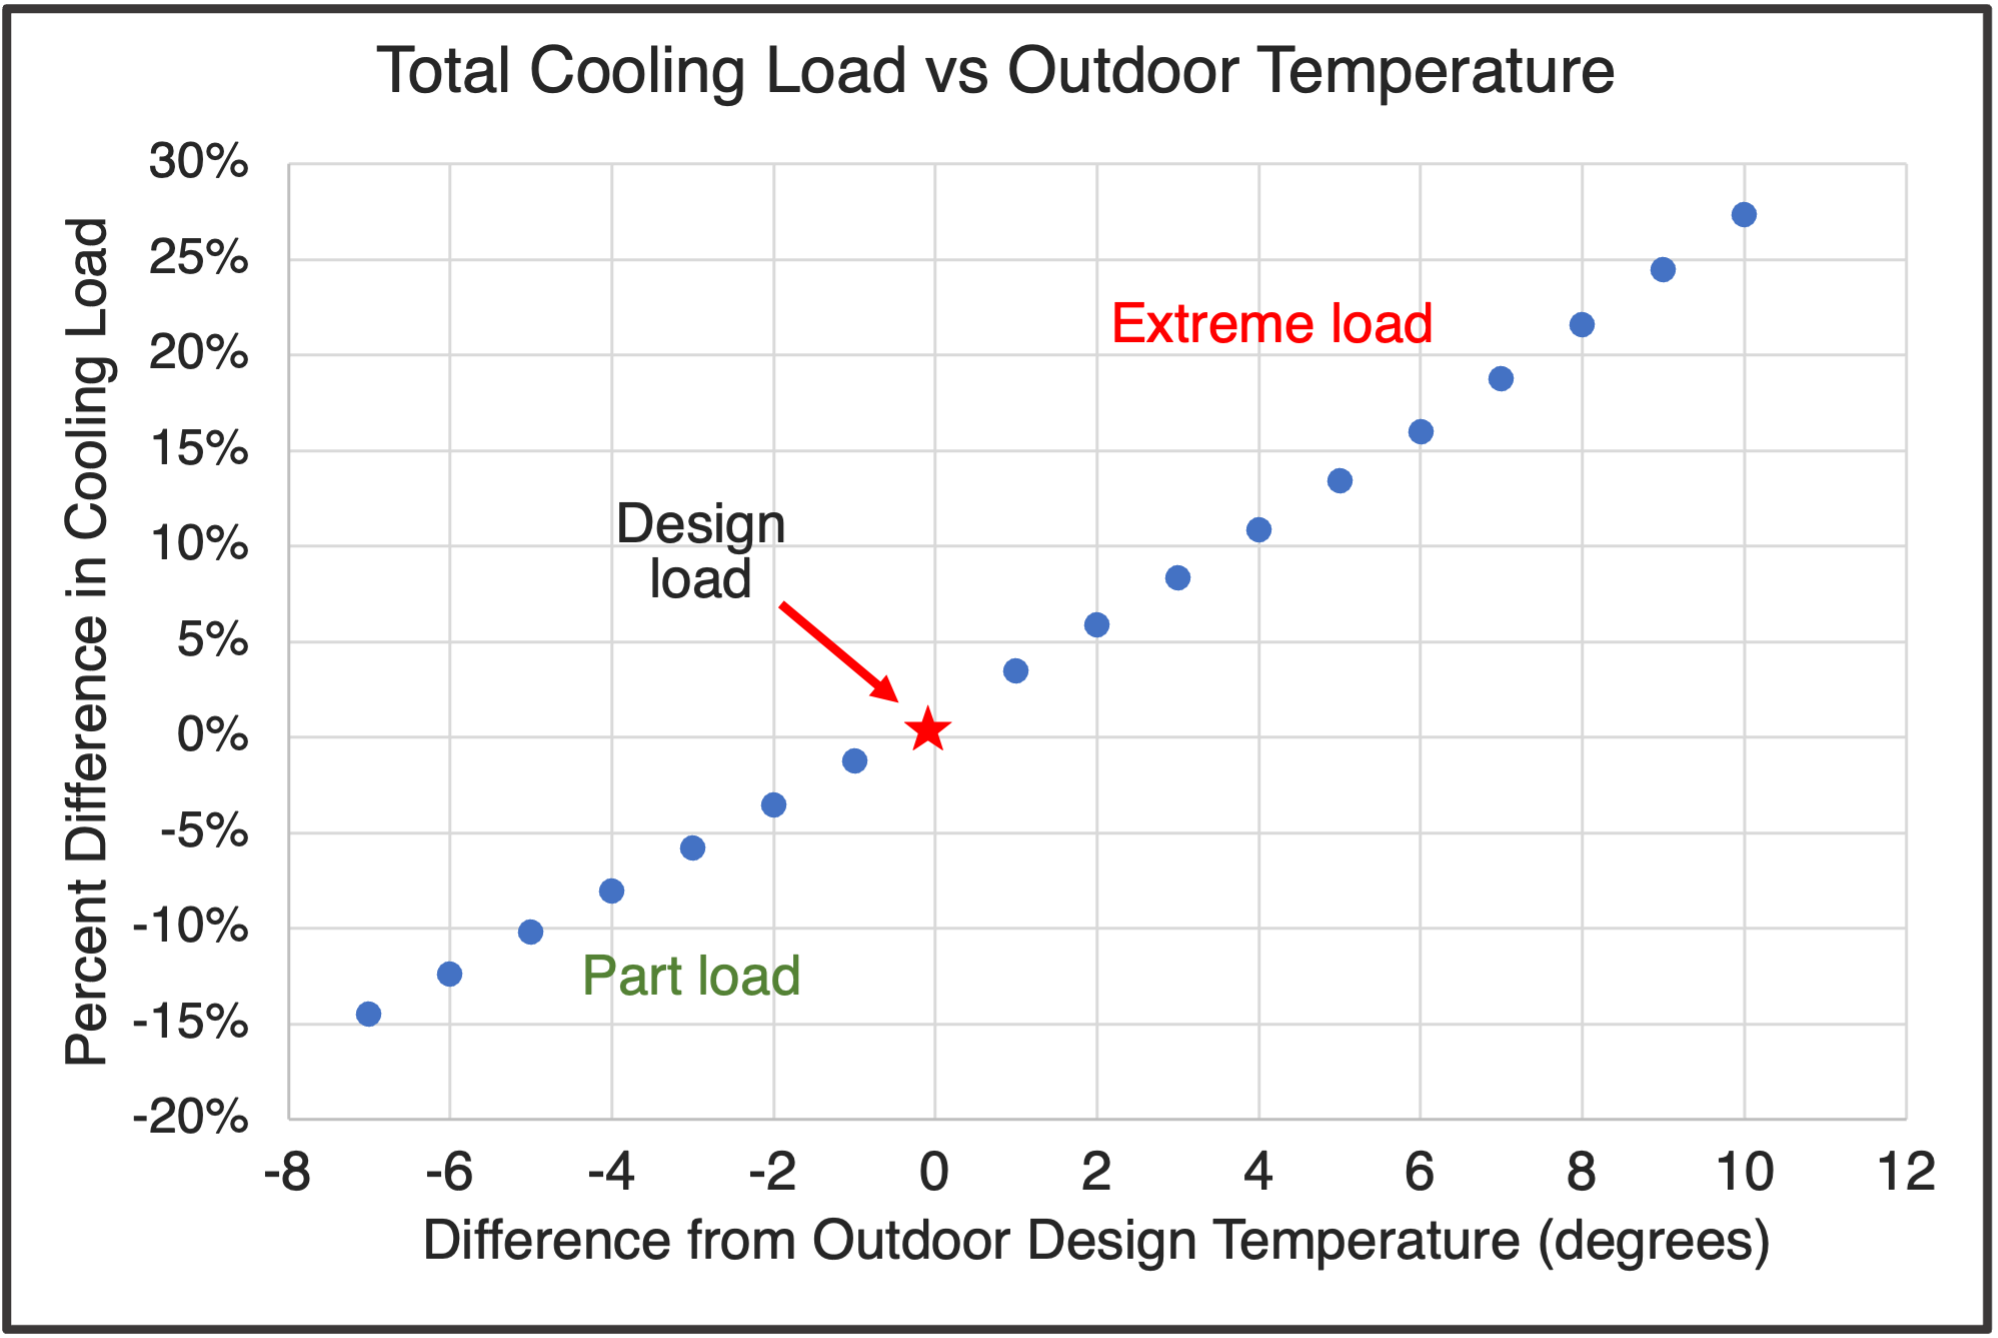
With outdoor temperatures lower than the design temperature, the cooling load decreases. Those are considered part-load conditions. As the outdoor temperature goes above the design temperature, the cooling load increases. That’s the extreme load side.
As you can see, the cooling load increases significantly with higher outdoor design temperature. An increase of just 2 °F results in 6 percent more total cooling load. Going up 5 °F, from 93 to 98 °F, increases the load 13 percent. And with a 10 °F increase, the total cooling load grows by 27 percent. In my house, that means going from 21 kBTU/hr to 27 kBTU/hr.
In short, changing the outdoor temperature increases or decreases the cooling load by ~2.7% for each degree of increase or decrease in this example.
What about outdoor humidity?
In the analysis above, I’ve changed only the outdoor dry bulb temperature. The HVAC design software we use at Energy Vanguard is RightSuite Universal, and it deals with the humidity (latent load) in an interesting way. It keeps the outdoor wet bulb temperature constant. What that means is that the latent load, the part related to removing humidity, actually goes down as the outdoor dry bulb temperature goes up.
It’s certainly possible that the latent load will go up as the outdoor temperature increases, but let’s focus just on the part related to changing dry bulb temperature, the sensible load. The graph below pulls out just the sensible load.
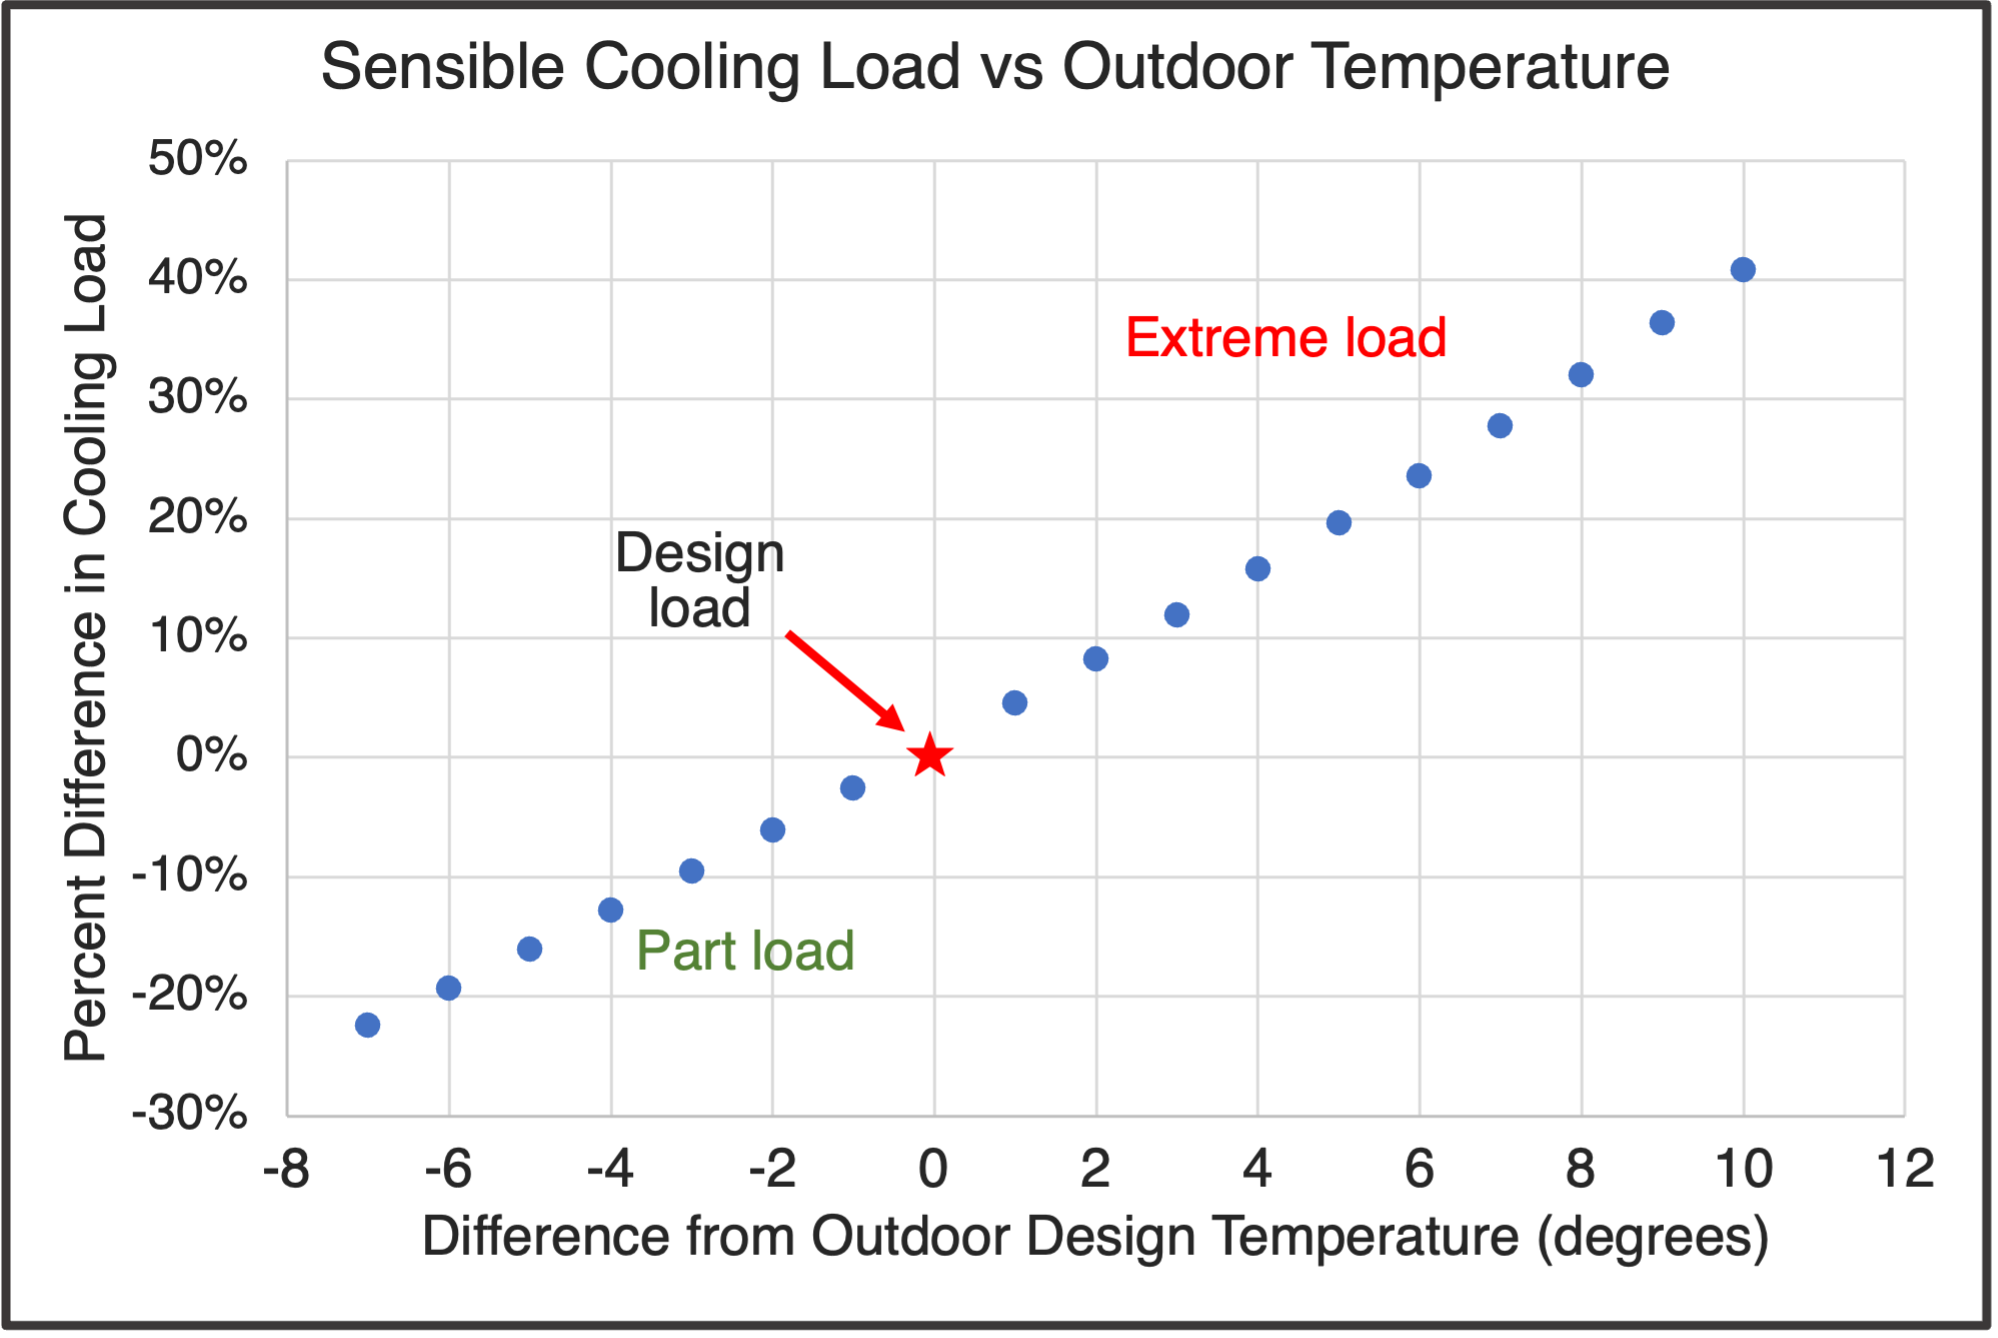
Everything is the same here except for the scale. Now, a 5 °F increase from 93 to 98 °F increases the load 20 percent. A 10 °F increase blows up the total cooling load by 41 percent. In my house, that means the sensible load goes from 17.5 kBTU/hr to 24.7 kBTU/hr.
Indoor temperature
OK, what happens if you leave the outdoor temperature at the 1 percent design temperature but change the indoor temperature. That’s your thermostat setpoint. Again, we’re changing only the dry bulb temperature. The software this time deals with the humidity by keeping the indoor relative humidity constant at 50 percent.
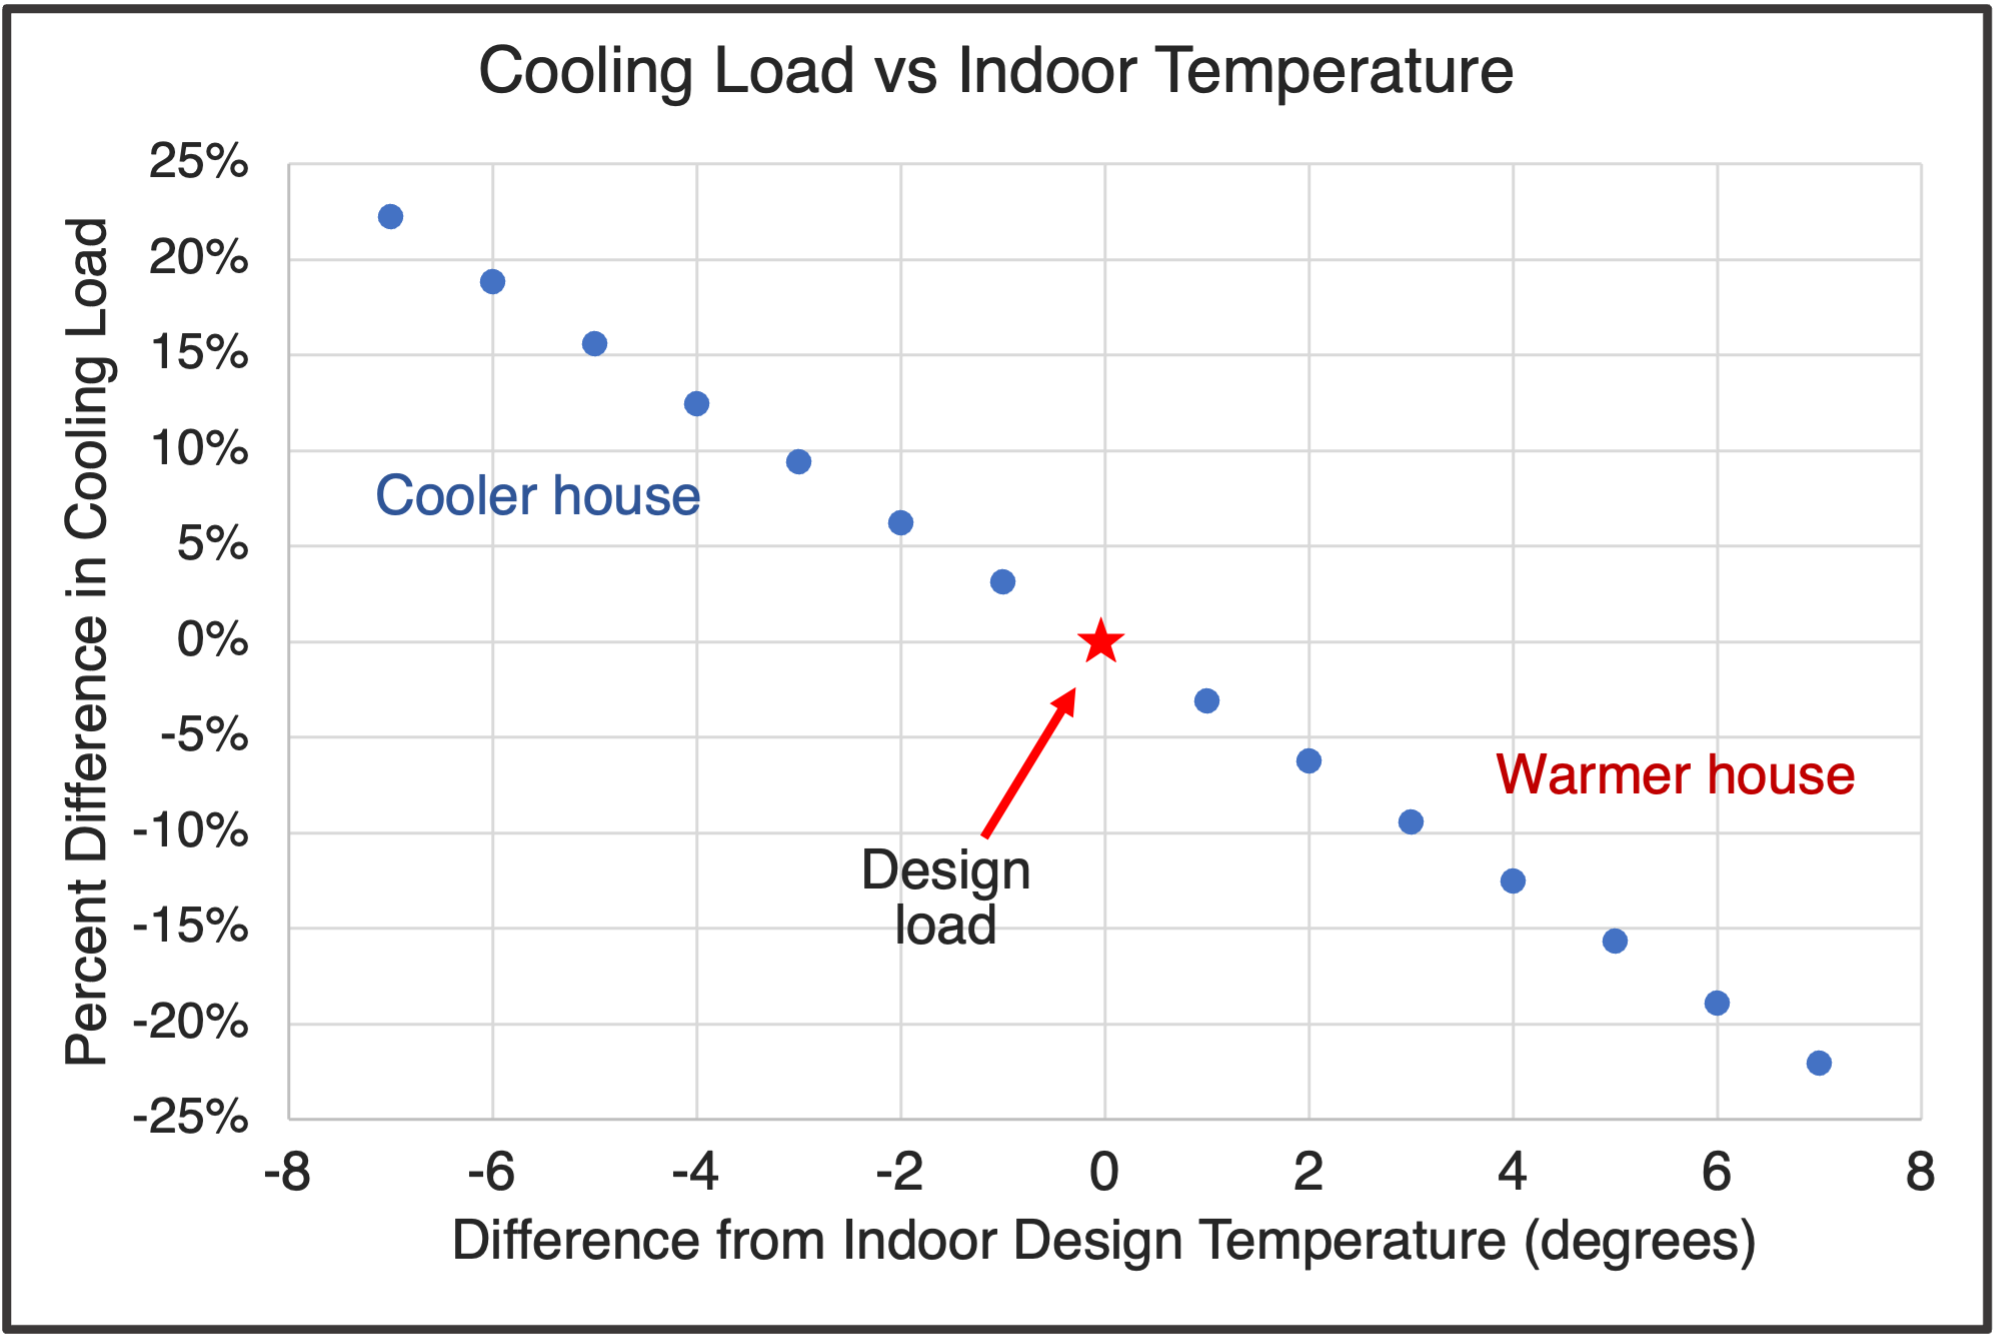
The graph above is similar to the other two. The slope of the curve is different because increasing the thermostat setpoint keeps the house warmer, which means less air conditioning. The percent change in cooling load is similar to what happens to the total cooling load when you change the outdoor temperature.
The Manual J indoor design temperature is 75 °F. A 2 °F decrease, from 75 to 73 °F, results in 6 percent more total cooling load. Keeping the thermostat at 70 °F, a 5 degree drop, adds nearly 16 percent more load. And keeping the thermostat at 68 °F increases the cooling load by 22 percent.
On the humidity side, by keeping the relative humidity constant at 50 percent, the latent load increases as you lower the indoor temperature. That causes the change in sensible load to be less than the change in total load in this case.
In short, changing the indoor temperature increases or decreases the cooling load by ~3% for each degree of decrease or increase in this example.
Takeaways
If your goal is to cheat on a Manual J load calculation, the above graphs make clear that changing the outdoor and indoor setpoints can help you do that. But that’s also one of the easiest things for someone checking the reports to find. But my point here is simply to show the cooling load variation you get as the outdoor or indoor temperatures change.
For those of you who do heating and cooling load calculations and HVAC design, changing the design temperatures is a form of bracketing. You find the range of cooling loads that might be reasonable. If, for example, you’re looking at selecting a piece of cooling equipment that’s right on the edge, going through an exercise like this can confirm your choice or perhaps lead you to select different equipment.
Keep in mind that the Manual J load calculation protocol does result in heating and cooling loads that are higher than the actual loads. There’s buffer built into it, so you’ll get a load that’s 10 to 30 percent higher than actual just using the standard inputs. Also, be aware that the equipment selection protocol, Manual S, allows you to size a cooling system at 90 percent of the Manual J load.
Of course, outdoor and indoor design temperatures are only one of the many variables that can affect your heating and cooling loads. Another biggie is infiltration rate. How far off might your load calculation be if you don’t have a blower door test result and make a bad guess? Hmmmm.
Allison A. Bailes III, PhD is a speaker, writer, building science consultant, and the founder of Energy Vanguard in Decatur, Georgia. He has a doctorate in physics and is the author of a bestselling book on building science. He also writes the Energy Vanguard Blog. For more updates, you can subscribe to the Energy Vanguard newsletter and follow him on LinkedIn.
Related Articles
How to Read Manual J Load Calculation Reports
How to Cheat on a Manual J Load Calculation
We Are the 99% — Design Temperatures & Oversized HVAC Systems
5 Tips for Sizing an Air Conditioner
Photo of thermometer by Mr.TinMD from flickr.com, used under a Creative Commons license.
Comments are welcome and moderated. Your comment will not appear below until approved.
This Post Has 12 Comments
Comments are closed.
A Balance Point graph is also very useful – I found graphing the load of the house against the maximum COP of the heat pump. In Zone 6A this is useful in determining when the second stage (NG boiler) needs to come on.
Bill: Yeah, balance point diagrams definitely help when looking at heating loads versus capacity. I’ve never heard of anyone doing that for cooling, but the same principle would apply. As the outdoor air gets hotter and hotter, the cooling load increases and the air conditioner capacity decreases.
I have often wondered whether the cooling load is really that linear since a significant amount of load is temperature independent. In other words, the relationship between temperature and cooling load is not a straight line and instead decreases slightly in extreme weather events that occur later in the heating season (late July and August). If the home has a significant amount of radiant load from windows, this will typically max-out earlier than the peak temperature (assuming minimal south shading effects).
Neal: How the cooling changes throughout the cooling season would be interesting to look at. Also, the amount of cooling load variation would depend on the particulars of the house. As you mention, a house with a lot of direct solar gain from windows would be different from a house with less window area, better windows, and overhangs. Also, small houses where the internal loads form a bigger part of the cooling load would show less change in the cooling load with temperature.
Allison — You struck an item in our industry that is quite misunderstood. As you ans I have discussed before, Manual J does not calculate heating and cooling loads. It ESTIMATES heating and cooling loads. When people take the results of those calculations as the true load, they are severely tempted to go to higher capacity equipment. That equipment is then oversized, under performs efficiency wise, and in moist climates underperforms in humidity removal.
We have proven in numerous tests in the field that the actual SENSIBLE cooling load is less than Manual J estimated load. Not just by a little bit, but usually the true sensible cooling load at design is 2/3rds of MJ. Let it also be noted that the MJ latent load is often lower than the actual latent load in damp climates. Thank you Allison
John: There’s definitely some significant buffer built into the calculations. Thanks for bringing that into the conversation here.
To be clear, changing your design point isn’t always cheating, but smart.
1. Many have reported that Manual J highly overestimates the loads, which results in equipment short cycling. Changing the design point is one solution for that.
2. Some people want their house to be like a frigid icebox, others (like me) hate the feeling of AC and will never run it until it’s absolutely miserable (85-90F). Some people run hot and some run cold. Some are willing to manage temperatures by using shades, move to other areas of the home which are cooler, etc. in an effort to avoid that cold feeling and to save energy.
You are allowed to have zero AC so if you do get it, why shouldn’t you be allowed to select the level that you want?
Cindi: Yes, Manual J does overstate the loads. See the comment by John Proctor. We do change the indoor and outdoor design temperatures occasionally, but you have to be careful with how far you go. Some programs and codes require certain numbers or ranges. And keeping the thermostat set really low in a hot humid climate can cause problems, like, for example, totaling your house.
10 Consequences of Keeping Your Home Really Cold in Summer
I’ve been using my ecobee thermostat logging feature to show the actual runtimes. I look at a “design day” of 102 degF (for me this was yesterday in Dallas) and see the runtime during 8 hours of the afternoon is 6.0 hours runtime or 75%. So my cooling load is 75% of my estimate of the A/C output and I include a 20% for the flex ducts in the attic. Could this be more accurate than any ManJ calc?
Bruce: Yes, measuring runtime is the best way to determine the actual load. Well, actually it’s the best way to determine how closely your AC capacity matches the load. If you measure the capacity of the AC, then you know the load.
Bruce!
I’m in Dallas as well would love to connect. I’m in roofing and solar—and I’m learning about home performance. I bought a blower door because I want to help my clients who want solar to understand their home’s performance and how we can improve it before or in conjunction with adding solar.
I need some knowledgeable HVAC partners!
Feel free to call/text if want to connect: 214-893-5959
Best,
Travis Jones
Allison,
Can you tell me if the 30 year design temps are created on a rolling average or where those numbers derived years ago looking back 30 years from a specific date. I guess I am wondering if we continue to use the 1 % design temperatures that code requires us to are those design temperatures, especially the outdoor design temperature, beginning to take into account climate change?
Also the indoor design temp is not realistic for what clients actually want the temp to be especially in the summer. Why not use 70 degrees for both winter and summer indoor design temp.
I find HVAC contractors blaming code and required design temps for poor design.
Thanks